What is the Scenario in Decision Critical and how does it work?
How to change setting of the scenario
Scenario view (Single scenario view)
Scenario view (Comparative view)
Sharing methods (3 ways to share your scenario)
How to share a scenario by Team Access
How to share a scenario by Guest Access
How to share a scenario by Share Copy
Export report in the scenario to Excel
What is the Scenario in Decision Critical and how does it work?
As you learned in our Introduction to Decision Critical, a "Company" within your account serves as a central hub for your strategic planning activities. But the real power lies within the Scenarios. Each scenario acts as a unique business plan where you can explore different strategies, test assumptions, and forecast potential outcomes.
Now think of a scenario as a blueprint for your business. It's where you define your approach, allocate resources, and analyze the potential financial impact. Building a Scenario in Decision Critical empowers you to:
- Craft Strategic Options: Explore various strategies and see how they might influence your business performance.
- Test Assumptions: Evaluate the impact of changing market conditions, resource allocation, and other factors.
- Forecast Future Performance: Gain valuable insights into how your business might perform under different scenarios.
By effectively utilizing Scenarios in Decision Critical, you can make informed strategic decisions that drive your business towards success. This article dives deeper into the world of scenarios, guiding you through the process of building, analyzing, and leveraging them for optimal strategic planning.
In the analytics page, you will find a list of scenarios created under the company name. This way, all scenarios will be displayed within the company's scope.
Under each company, users can create and manage multiple "Scenarios."
A "Scenario" represents a specific set of decisions made under defined circumstances. Scenarios are where users input various assumptions and evaluate the impact of those assumptions on operational and financial outcomes.
To see a clearer picture of a Company, let's start with the instructional video: Add scenarios.

How to add a scenario
To add a scenario:
- In the scenario page, then click ADD A SCENARIO TO BEGIN WORKING (or CREATE NEW SCENARIO).
- Enter the details of the scenario. (See the explanation of each field below)
- To add the additional details, click Additional settings.
- Once you have completed adding all the details of the scenario, click CREATE. The scenario will be created and ready to add an assumptions.

-
Scenario details
- Company name: Choose a clear and descriptive name for your scenario. This will help you easily identify and reference it later.
- Short description (Optional): A brief note to your company. This can be helpful for internal reference and organization, especially if you create multiple scenarios.
- Based currency (In ....): Select the currency in which you want to express all financial data within this specific scenario. This will be the reference point for calculations and reports generated for this scenario.
- Forcast horizon: Define the timeframe for your financial projections within this scenario. This establishes the duration for which Decision Critical will calculate future revenue, expenses, and other financial metrics.
- Start date: Set the starting date for your scenario. This typically represents the current date or the beginning of your chosen forecast horizon. Choosing a future start date allows you to model scenarios that begin at a specific point in time.
How to delete a company
To delete your company, navigate to the scenario settings of the specific scenario you wish to delete.
- In scenario you want to delete, click on Setting icon near the scenario name.

- In SCENARIO SETTINS, Click DELETE SCENARIO, at the buttom right.
- In the Delete Scenario window, Click CONFIRM to confirm your deletion.

How to change settings of the scenario
Primary settings (e.g. scenario name, description)
To change settings of the scenario, navigate to the scenario settings of the specific scenario you wish to make changes to. You can do it by clicking the Scenario icon near the scenario name

Once you have made the necessary changes, simply press the Enter key on your keyboard to save the modifications.
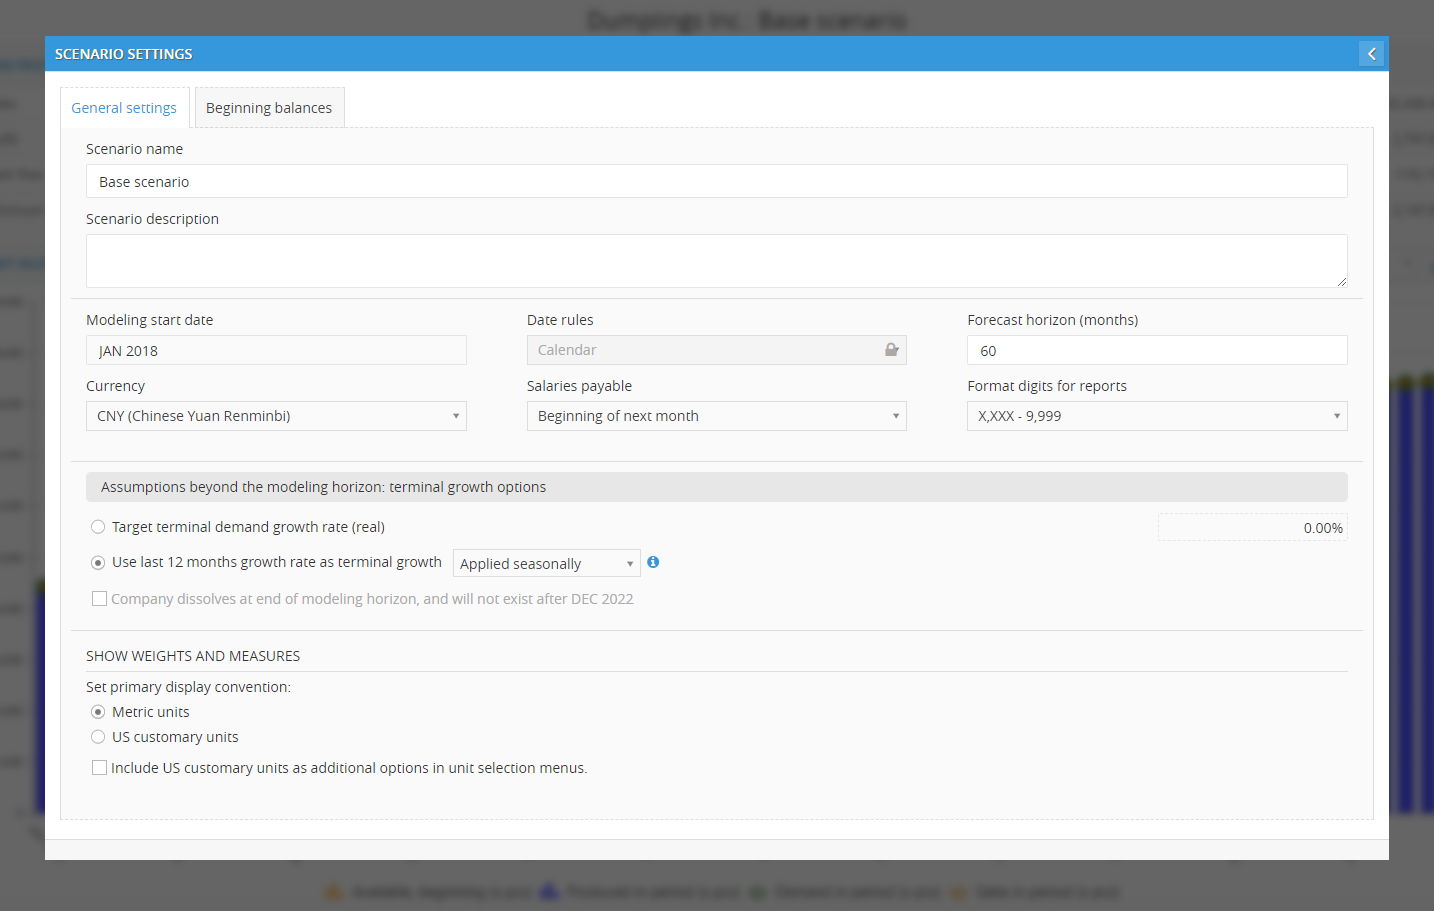
Advanced settings
Scenario settings in Scenario page for only the general setting like name, description but for the advance setting, open scenario then click the setting icon on the top right.
There will be General settings and Beginning Balance settings, just simply switching by a tab on the top left :
- General settings:

- Modeling Start Date: This defines the date from which your financial projections will begin.
- Date Rules: This specifies how dates are handled within your model (e.g., fiscal year vs. calendar year).
- Forecast Horizon (months): This determines the duration for which your financial projections will be calculated (e.g., 12 months, 24 months).
- Currency: This sets the currency used for all financial data within the model (e.g., USD, EUR).
- Salaries Payable: This option allows you to choose when salaries are paid to employees in the model (e.g., beginning of next month, end of current month).
- Format Digits for Reports: This specifies how numbers will be displayed in reports generated by the model (e.g., number of decimal places, commas for separators).
- Terminal Growth Options: This section deals with how the model will project financial data beyond the defined forecast horizon. You can choose one of two options
- Target Terminal Demand Growth Rate (real): This allows you to manually define a specific growth rate for the model to use beyond the forecast horizon.
- Use Last 12 Months Growth Rate as Terminal Growth by: This option uses the average growth rate from the last 12 months of your model data and applies it (seasonally or smoothed) to project growth beyond the forecast horizon.
- Applied Seasonally: This maintains any seasonal trends present in the historical data when projecting future growth.
- Smoothed: This smooths out any fluctuations in the historical data to provide a more stable growth rate projection.
- Company Dissolves at End of Modeling Horizon, and will not exist after {Date} : This allows you to specify that the company represented in the model ceases to operate after the defined date.
-
Set Primary Display Convention: This allows you to choose the default unit system used for displaying values within your model.
You can select either Metric Units (meters, kilograms) or US Customary Units (feet, pounds). - Include US Customary Units as Additional Options: This lets you decide if US Customary Units should be available alongside the Primary Display Convention Units in the unit selection menus.
- Beginning balance: This section lets you set the starting financial position (cash, inventory, etc.) for your company as of the modeling start date. You can do it by click ADD ACCOUNT, choose an account you like to add the add the value.
It's not needed for new businesses starting from scratch.
Scenario Views: Single scenario view
Single scenario view: Get a Comprehensive Picture

The Single Scenario View provides a holistic overview of a single forecasting scenario. This view displays the four key financial dimensions – Sales, Profit, Cash Flow, and Minimum Cash Balance – for each period within your chosen forecasting timeframe (e.g., 5 years).
Essentially, this view allows you to see:
- Projected Trends: How each financial dimension is expected to perform over time.
- Forecasted Values: The specific numerical values for each dimension across each forecasting period.
- Interconnected Performance: How changes in one dimension (e.g., Sales) might impact others (e.g., Profit).
By analyzing the Single Scenario View, you can gain valuable insights into the financial health of your projected scenario. This helps you make informed decisions and identify potential areas of concern before they arise.
-
Sales
Tracks your projected sales: See the accumulated value of your forecasted sales throughout the forecasting period. This metric also displays the Compound Annual Growth Rate (CAGR%).

-
Profit
Monitors your projected profitability: View the accumulated value of your forecasted profit over the forecasting period.

-
Cash flow
Manages your projected cash flow: Understand your projected cash flow throughout the forecasting period. This metric helps you anticipate how much cash you will have on hand during this time.
-
Cash flow
Manages your projected cash flow: Understand your projected cash flow throughout the forecasting period. This metric helps you anticipate how much cash you will have on hand during this time.
Scenario Views: Comparative view
Let's start by looking at the more advanced option - Comparative view.
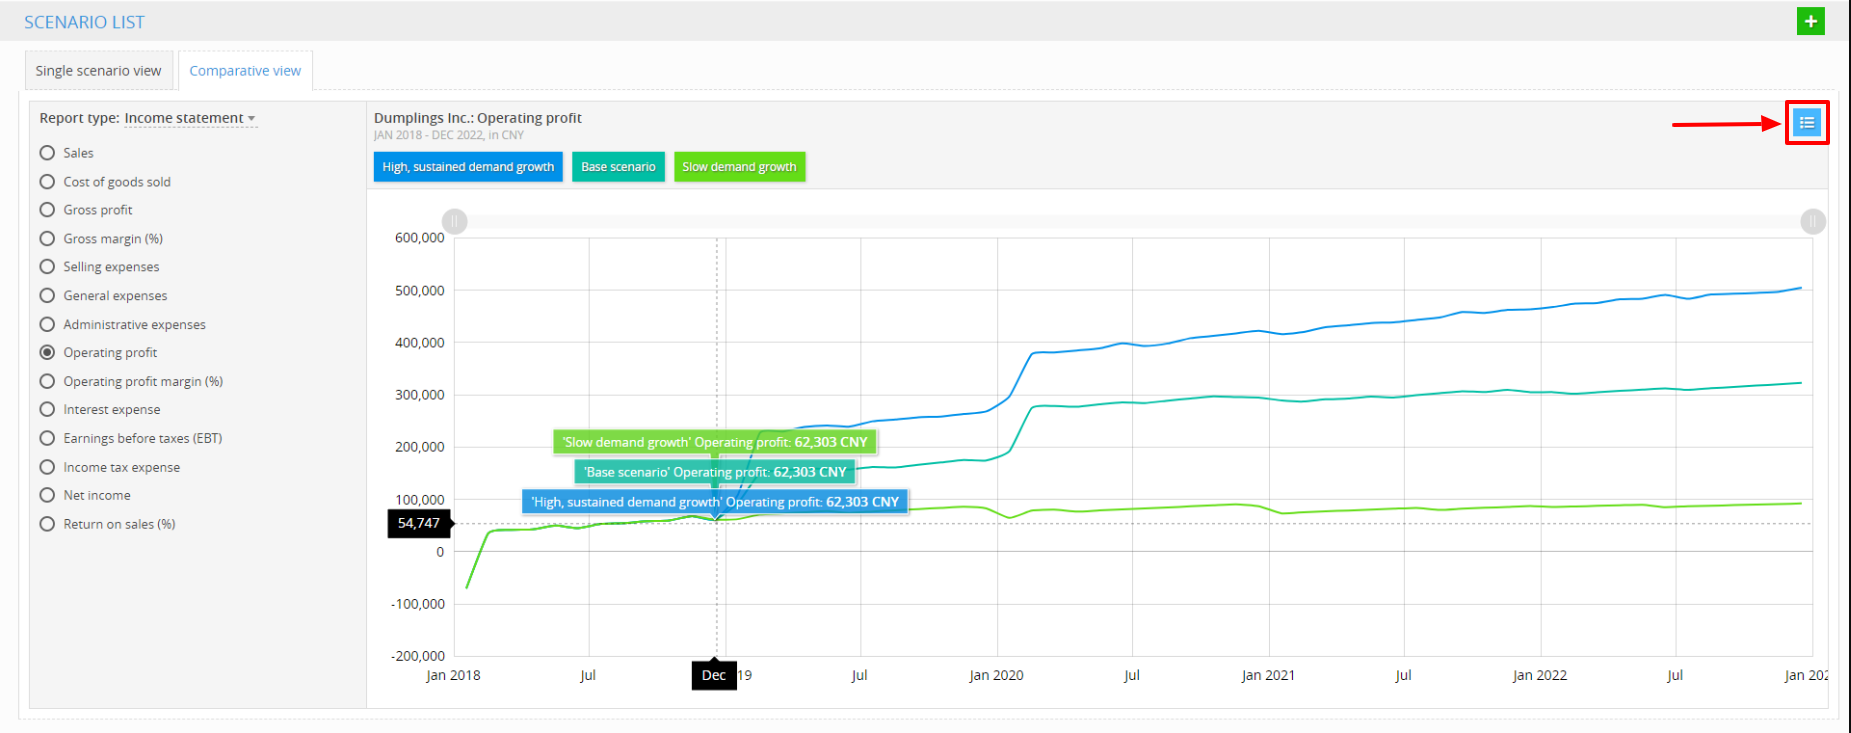
Comparative view: See Scenarios Side-by-Side

The Comparative View in Decision Critical is your powerful tool for visually comparing the performance of multiple scenarios. This allows you to:
- Uncover Trends and Differences: Line charts bring your scenarios to life. You can compare how Sales, Profit, Cash Flow, and Minimum Cash Balance evolve over the forecasting period for different scenarios. Each line represents a scenario, plotted against the forecasting period (X-axis) and the chosen financial metric (Y-axis).
- Make Informed Decisions: By comparing scenarios visually, you can identify which scenario best aligns with your business goals.
The Comparative View provides deeper insights into how each scenario impacts your financial health over the forecasting period. Here’s how:
- Select a report type: Select from Balance Sheet, Income Statement, or Cash Flow to view a detailed breakdown of the chosen line item.

- Choose the line items: Within the chosen report type, you can further analyze specific financial metrics.This allows you to understand the underlying components that contribute to your overall financial health in each scenario.

- Explore the comparative view through visualization and compare different aspects to discover the valuable insights.

How to replicate my scenario to my another company
To copy your scenario and send to your another company:
- View scenario by Scenario scenario view, click Scenario copy icon (Single scenario view) in the scenario you wish to copy.
- In Scenario Copy window, select a company from the dropdown menu labeled "Copy to company:" to identify the company you want to replicate to.

- Enter the Scenario name and Short description (We suggest choosing a different name for the scenario and including an additional description to clarify that it is a copied scenario. This will help prevent any confusion).

- Click COPY.
- Done, the scenario has been sent to another company. You can now go check the company to which you have replicated the scenario.

How to share the scenario
To share your scenario:
- View scenario by Scenario scenario view, click Scenario share icon (Create scenario on basis of this scenario) in the scenario you want to share.

- In Scenario Access, you have 3 sharing methods to choose from, which is Team Access, Guest Access and Share Copy. Select one of these three method to share. (How do these three methods work?)

Sharing methods (3 ways to share your scenario)
1. Team Access: How to share a scenario by Team Access ?
To share using team access, you need to have two users of the same subscription plan to share.
- -
2. Guest Access: How to share a scenario by Guest Access ?
To share using guest access, set the destination and sharing conditions:

- Grant access to: Email address of the person you want to share the scenario with.
- Access rights:
- Read-only: lets viewers see key reports & analytics, but keeps the scenario itself protected from edits. Check on ‘Allow copying’, if you allow the recipent copying your shared scenario.
- Collaborative: lets team members edit assumptions and reports, fostering active scenario development. Check on ‘Allow copying’, if you allow the recipent copying your shared scenario.
- Access period: Set the time of the access's availability. - Select when the access end; OPEN-ENDED is no ending
- Massage (optional): Write a note to the recipient.
Then click CONFIRM to confirm the sharing.
3. Share Copy: How to share a scenario by Share Copy ?
To share using a share copy method, set the destination and sharing conditions:

- Share copy to: Enter an email address of person you want to share a scenario with.
- Massage (optional): Write a note to the recipient.
Then click CONFIRM, to confirm the sharing.
📑 Read more about expanded scenario sharing in Expanded Scenario Sharing blog.
Scenario Report
Scenario report is a quick way to access a financial statement of each scenario allows you to analyze the potential financial performance of your business strategies through scenario reports effortlessly.
A crucial part of this analysis is understanding the projected financial statements within each scenario. To access a scenario report:
- View scenario by Scenario scenario view, click Scenario report icon (Show reports this scenario) to open Scenario Report.

- In the Scenario Report, you can view all three financial statements; balance sheet, income statement, and cash flow statement. Switch the financial statements report by clicking on a tab on the top left.
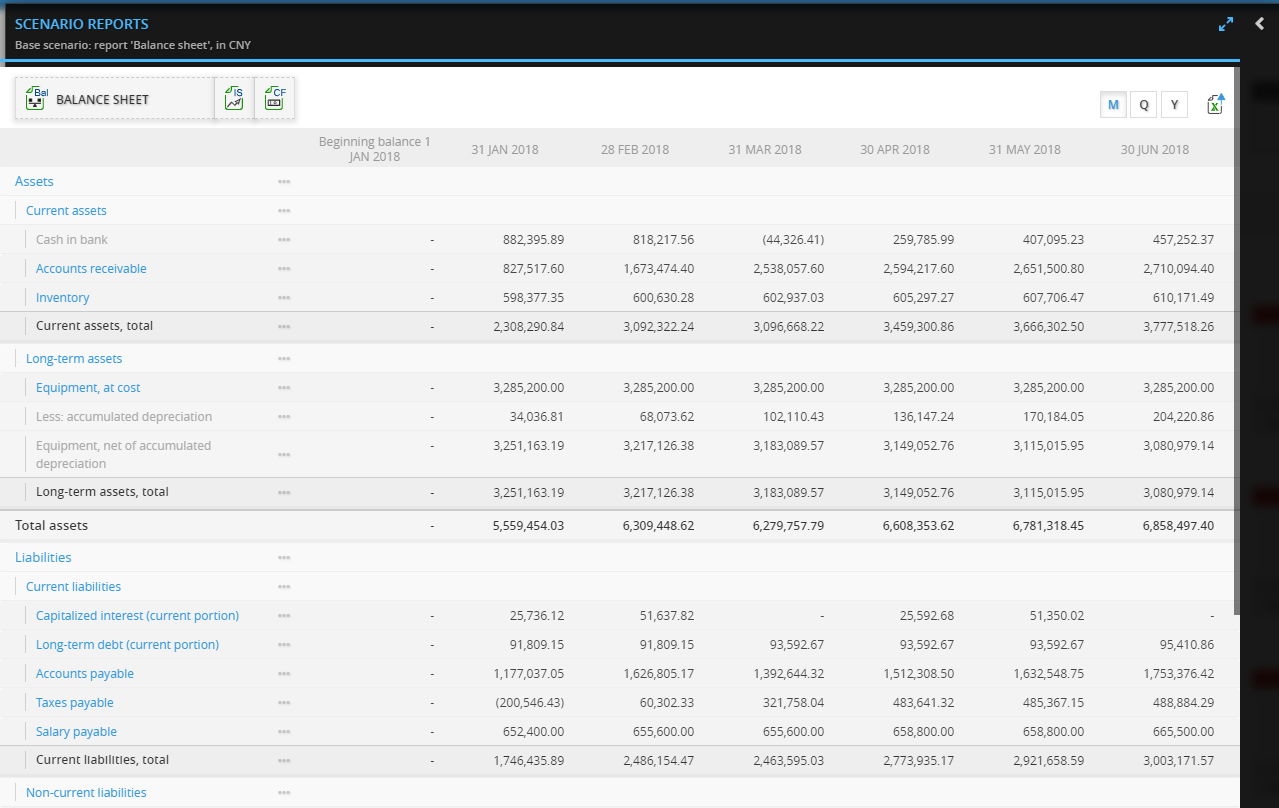
- In addition, you also have the flexibility to switch the view to month (M), quarter (Q), or year (Y). You can even export it to Excel or view it in full screen mode if you prefer.

- You can also view charts for individual financial metrics by clicking the three dots icon next to the metric, then selecting "Show chart of this report."

Inside the scenario page

After you get into the scenario, There will be three main components, which are:
- Assumptions (on the left-hand side of the landing screen): When diving into your scenario, it's important to establish your key assumptions. These are essentially your best guesses about factors that might influence your budget or overall strategy.

Here's a breakdown of the three main assumption sections:
- Business Concept: Identify your core business idea, its target market, and its unique value proposition. (e.g., Organizational Structure, Products)
- Resource Allocation: Outline how you plan to allocate resources (e.g., Staff, Equipment, Financing) to support your business concept.
- Business Environment: Consider external factors that might impact your business. (e.g., Tax, Utilities) - Dashboard (in the center of the landing screen): Dashboard in scenario provides a central hub for visualizing key performance indicators and exploring data in various formats. Here's a breakdown of its components:
-
Mini Profile: Mini profile section offers a quick snapshot of your scenario's financial health. It displays essential metrics:
- Sales
- Profit
- Cash Flow
- Minimum Cash BalanceThese values are presented alongside the forecasting period, allowing you to see projected performance at a glance.

-
Analytics: Analytics empowers you to delve deeper into the scenario's report. It offers a variety of visualization options, including:

-
Line Graphs: Track trends and identify patterns over time for key metrics.
-
Bar Charts: Compare different categories or scenarios visually for easy interpretation.
-
Financial Performance Table: View detailed financial performance data breakdowns for comprehensive analysis.
-
Product Map Flowchart: Offers an optional production flowchart component. This visual tool helps you understand and communicate the step-by-step process of manufacturing a specific product within your scenario.
The specific visualizations available will depend on the report type you've selected (e.g., Operational Report, Cash Balance). This dynamic approach allows you to tailor your exploration to the specific data you're interested in.

-
-
-
Report (on the right-hand side of the landing screen): provides the groundwork for your business analysis. It outlines key factors that can influence your financial performance and overall strategy.

- Balance Sheet: Snapshot of what you own (assets), owe (liabilities), and net worth (equity) at a specific time.
- Income Statement: Shows revenue earned and expenses incurred over a period.
- Cash Flow Statement: Tracks cash flow from operations, investing, and financing activities.
- Cash Balance Chart: Tracks your cash position over time.
- Unit Sales: Details the number of units sold over a period.
- Units Produced: Tracks the number of units produced over a period.
- Headcount: Tracks the number of employees over a period.
- Equipment Roll-out: Tracks equipment acquisition and deployment.
- Footprint: Analyzes your space requirements over time.
See the full guide about Report here
- We strongly suggest that you hover over to see tooltips that will provide their detail and value within the chart.

- In the visualization that is shown in table form, like a balance sheet, you can still see the chart by clicking on the tree dot icon > chart icon.

Other than three components we mentioned, there still some essential options in scenario page you should know, all located at the top right in the page:
- Export report in the scenario to Excel: We've made it easy for you to export the reports to an Excel file. Simply select the report you'd like to export and you're good to go!

- Scenario settings: You can choose to modify the settings of the scenario, such as the General Settings or the Starting Balance.
- Return back to analytics page.
📨 Send our support team a note at support@decisioncritical.pro