In Decision Critical, reports are the primary tool for measuring the immediate impact of your assumptions on both operational and financial outcomes. Located on the right-hand side of your scenario screen, these reports translate your raw data into actionable business intelligence.
This guide explains the purpose of each report and how to interpret the results to refine your business strategy.
1. Core Financial Statements
These reports provide a professional-grade view of your scenario’s fiscal health, following standard accounting principles.
-
Income Statement: Measures profitability over time by tracking revenues against expenses. Use this to see if your business model is generating a net profit.
-
Balance Sheet: Displays the financial position of the company (Assets, Liabilities, and Equity) at specific points in time.
-
Cash Flow Statement: Tracks the actual movement of cash in and out. This is different from profit, as it accounts for the timing of payments and investments.
2. Operational & Capacity Analysis
These reports help you identify "bottlenecks"—areas where your production or resources cannot meet customer demand.
-
Operational Report: A comprehensive view used for understanding the relationship between production, throughput, and final sales.
-
Unit Sales: Shows actual units sold. Crucially, this reflects the lesser of either total demand or your current availability/capacity.
-
Units Produced: Compares your production targets against your actual capacity. If this is lower than your target, you likely need more equipment or staff.
-
Headcount: A period-by-period breakdown of your total number of employees.
-
Footprint: A visual graph of your total space requirements (from equipment and staff) measured against the total physical space available in your Land and Buildings.
Summary Table: Which Report Should I Use?
| If you want to know... | Use this Report: |
| If the company is "broke" or out of cash | Cash Balance Chart |
| If the business is making a profit | Income Statement |
| If you have enough machines/staff to meet demand | Units Produced / Unit Sales |
| If you are running out of office or warehouse space | Footprint |
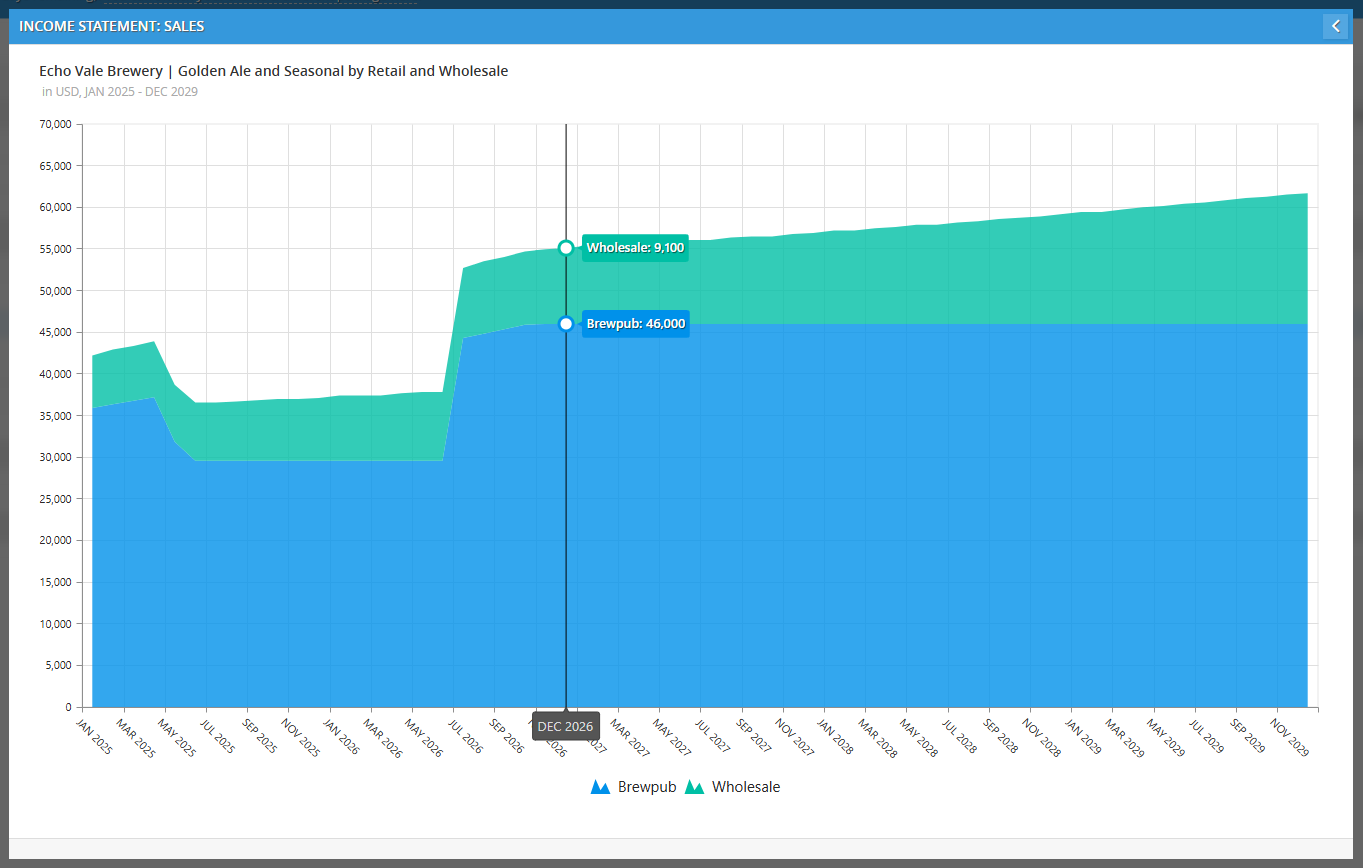
Financial Statements: Income Statement
In Decision Critical, your financial reports act as the "scoreboard" for your business strategy. They translate your operational assumptions—like how many pints of beer you brew or how many sales reps you hire.
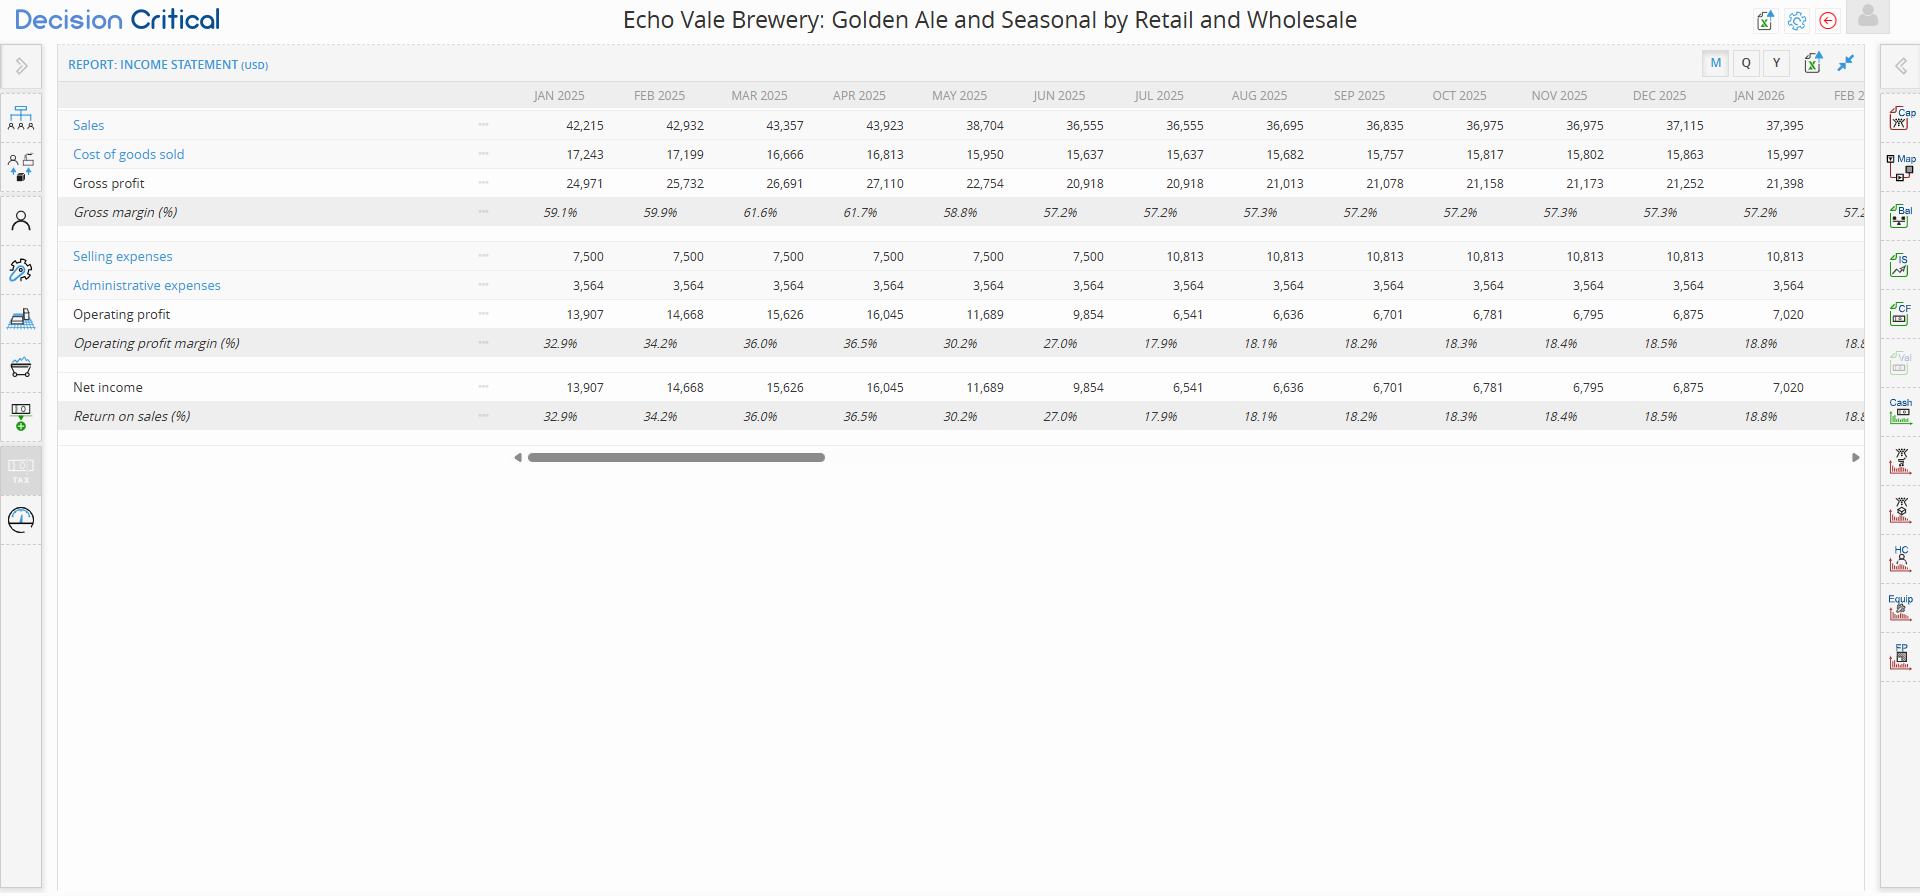
This guide focuses on the Income Statement, the primary report used to measure profitability and performance over time.
Step-by-Step: Navigating the Income Statement
-
Open the Report: On the right-hand sidebar of your scenario landing screen, click the Income Statement
-
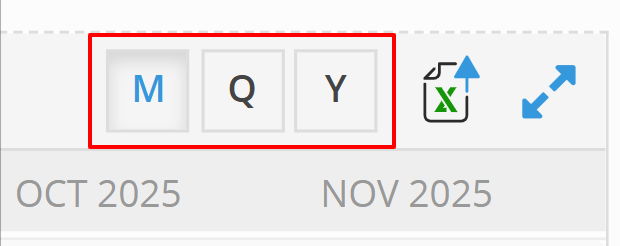
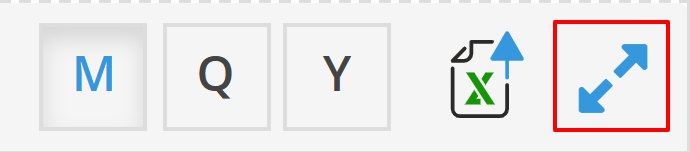
Toggle Your View: In the top right corner of the report, you can switch between M (Monthly), Q (Quarterly), and Y (Yearly) views to see trends over different time horizons.
-
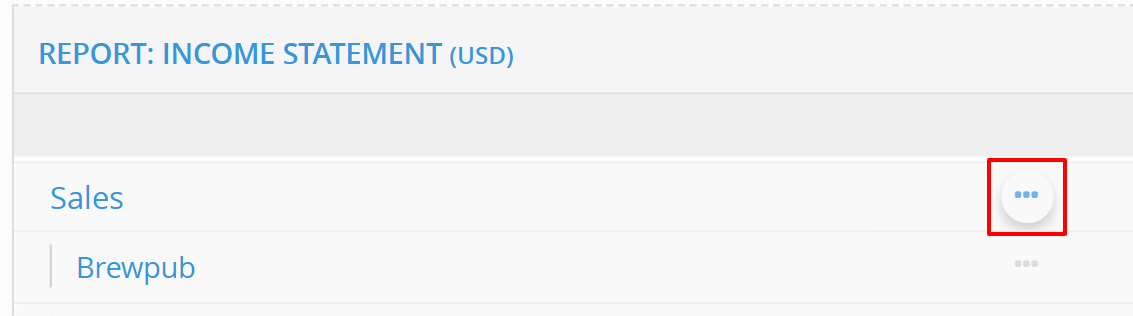
Drill Down into the Details: Any item listed in blue text is interactive. Click on a blue category (e.g., Sales or Selling expenses) to expand it and see the specific line items driving those numbers.
-
Analyze the Margins: Look at the percentage rows (e.g., Gross margin %) to see how efficiently your company is producing goods relative to its revenue.
-
Export Data: Click the Excel icon in the top-right corner to download your report data as a CSV or Excel file for external use.
- Expand view: Click diagonal arrows to maximizes the report to fill your screen
Understanding the Key Sections
The Income Statement is structured to show how revenue flows down into profit. Here is a breakdown of what each section represents:
-
Sales: This is your "Top Line" revenue. In the expanded view, you can see exactly which channels (like Brewpub vs. Wholesale) or products (like Golden Ale) are bringing in the most money.
-
Cost of Goods Sold (COGS): These are the direct costs tied to production. This includes "Direct" costs (raw materials and labor) and "Indirect" costs (factory overhead).
-
Gross Profit: Calculated as $Sales - COGS$. This tells you if your product pricing is high enough to cover production costs.
-
Operating Expenses (OpEx): These are the "fixed" costs of running the business, split into:
-
Selling Expenses: Marketing, sales staff salaries, and commissions.
-
Administrative Expenses: Rent, utilities, and management salaries.
-
-
Operating Profit: This is your profit before taxes and financing. It shows how the core business is performing.
-
Net Income: The "Bottom Line." This is what remains after all expenses, including depreciation and taxes, have been accounted for.
- Expand view: Click diagonal arrows to maximizes the report to fill your screen
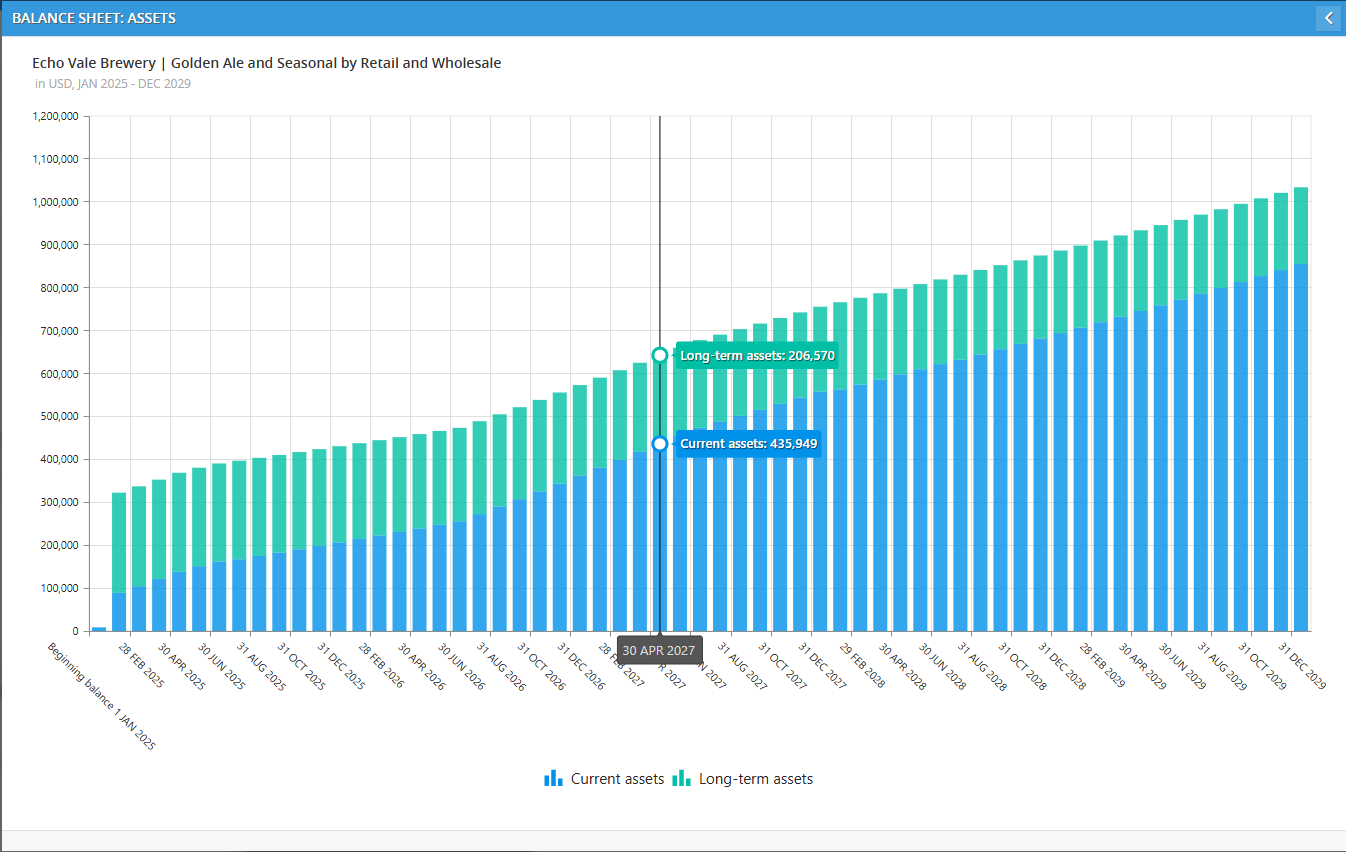
Financial Statements: Balance Sheet
The Balance Sheet (BS) in Decision Critical provides a "snapshot" of your company's financial position at any specific moment. While the Income Statement shows your performance over a period of time, the Balance Sheet shows what you own (Assets) and how those things were paid for (Liabilities and Equity).
This report is essential for seeing how your operations—like buying brewing equipment or building up beer inventory—affect your overall company value.
Step-by-Step: Navigating the Balance Sheet
-
Open the Report: Click the Bal (Balance Sheet) icon on the right-hand sidebar.
-
Toggle Your View: Use the M, Q, or Y buttons in the top right to view your balances monthly, quarterly, or annually.
-
Go Full Screen: Click the Expand icon (diagonal blue arrows) in the top right to see all rows clearly without scrolling.
-
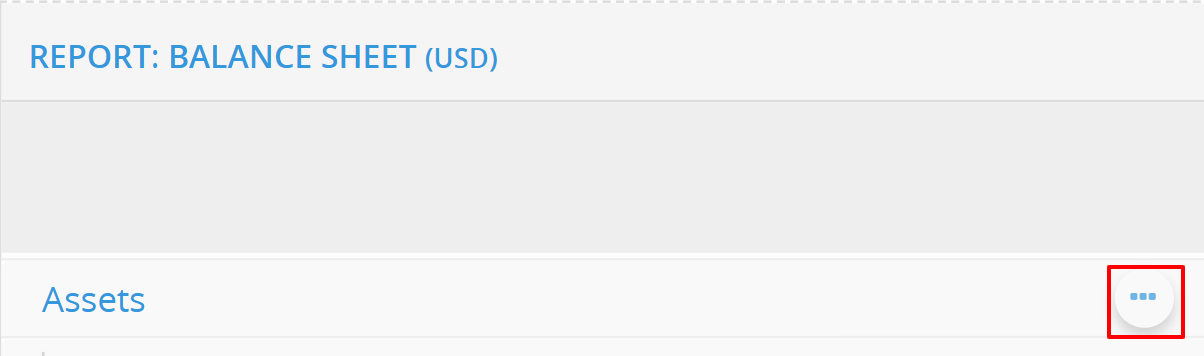
Audit the Details: * Expand Categories (Blue Text): Click any item in blue text (e.g., Current assets or Long-term assets) to see the specific items underneath, like Cash in bank or Equipment.
-
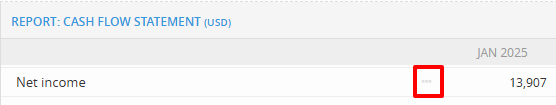
Visualize Any Line (Ellipsis Button): Click the ellipsis button (...) on the far right of any row to open a Drill-Down Graph. This is perfect for seeing how your cash reserves or inventory levels trend over the life of the scenario.
-
-
Export Data: Click the Excel icon in the top-right corner to download your report data as a CSV or Excel file.
- Expand view: Click diagonal arrows to maximizes the report to fill your screen
Key Sections for Business & Ops
The Balance Sheet follows a simple equation: Assets = Liabilities + Equity.
-
Current Assets: Things that can be turned into cash within a year.
-
Cash in bank: Your actual liquid money available.
-
Inventory: The value of the raw materials and finished goods (like your Golden Ale) currently in stock.
-
-
Long-term Assets: Big-ticket items that last for years.
-
Equipment, at cost: The total price you paid for your machines and tools.
-
Accumulated Depreciation: A "negative" number that tracks how much of that equipment's value has been "used up" over time.
-
-
Shareholders' Equity: This shows where the money came from to buy the assets.
-
Paid-in capital: Money put into the company by owners or investors.
-
Current/Retained Earnings: This is your profit. Current is from the current year, while Retained is profit from previous years that you've kept to reinvest in the business.
The Balance Sheet (BS) in Decision Critical provides a "snapshot" of your company's financial position at any specific moment. While the Income Statement shows your performance over a period of time, the Balance Sheet shows what you own (Assets) and how those things were paid for (Liabilities and Equity).
This report is essential for seeing how your operations—like buying brewing equipment or building up beer inventory—affect your overall company value.
Step-by-Step: Navigating the Balance Sheet
-
Open the Report: Click the Bal (Balance Sheet) icon on the right-hand sidebar.
-
Toggle Your View: Use the M, Q, or Y buttons in the top right to view your balances monthly, quarterly, or annually.
-
Go Full Screen: Click the Expand icon (diagonal blue arrows) in the top right to see all rows clearly without scrolling.
-
Audit the Details: * Expand Categories (Blue Text): Click any item in blue text (e.g., Current assets or Long-term assets) to see the specific items underneath, like Cash in bank or Equipment.
-
Visualize Any Line (Ellipsis Button): Click the ellipsis button (...) on the far right of any row to open a Drill-Down Graph. This is perfect for seeing how your cash reserves or inventory levels trend over the life of the scenario.
-
-
Export Data: Click the Excel icon in the top-right corner to download your report data as a CSV or Excel file.
Key Sections for Business & Ops
The Balance Sheet follows a simple equation: Assets = Liabilities + Equity.
-
Current Assets: Things that can be turned into cash within a year.
-
Cash in bank: Your actual liquid money available.
-
Inventory: The value of the raw materials and finished goods (like your Golden Ale) currently in stock.
-
-
Long-term Assets: Big-ticket items that last for years.
-
Equipment, at cost: The total price you paid for your machines and tools.
-
Accumulated Depreciation: A "negative" number that tracks how much of that equipment's value has been "used up" over time.
-
-
Shareholders' Equity: This shows where the money came from to buy the assets.
-
Paid-in capital: Money put into the company by owners or investors.
-
Current/Retained Earnings: This is your profit. Current is from the current year, while Retained is profit from previous years that you've kept to reinvest in the business.
-
-
-
Financial Statements: Cash Flow Statement
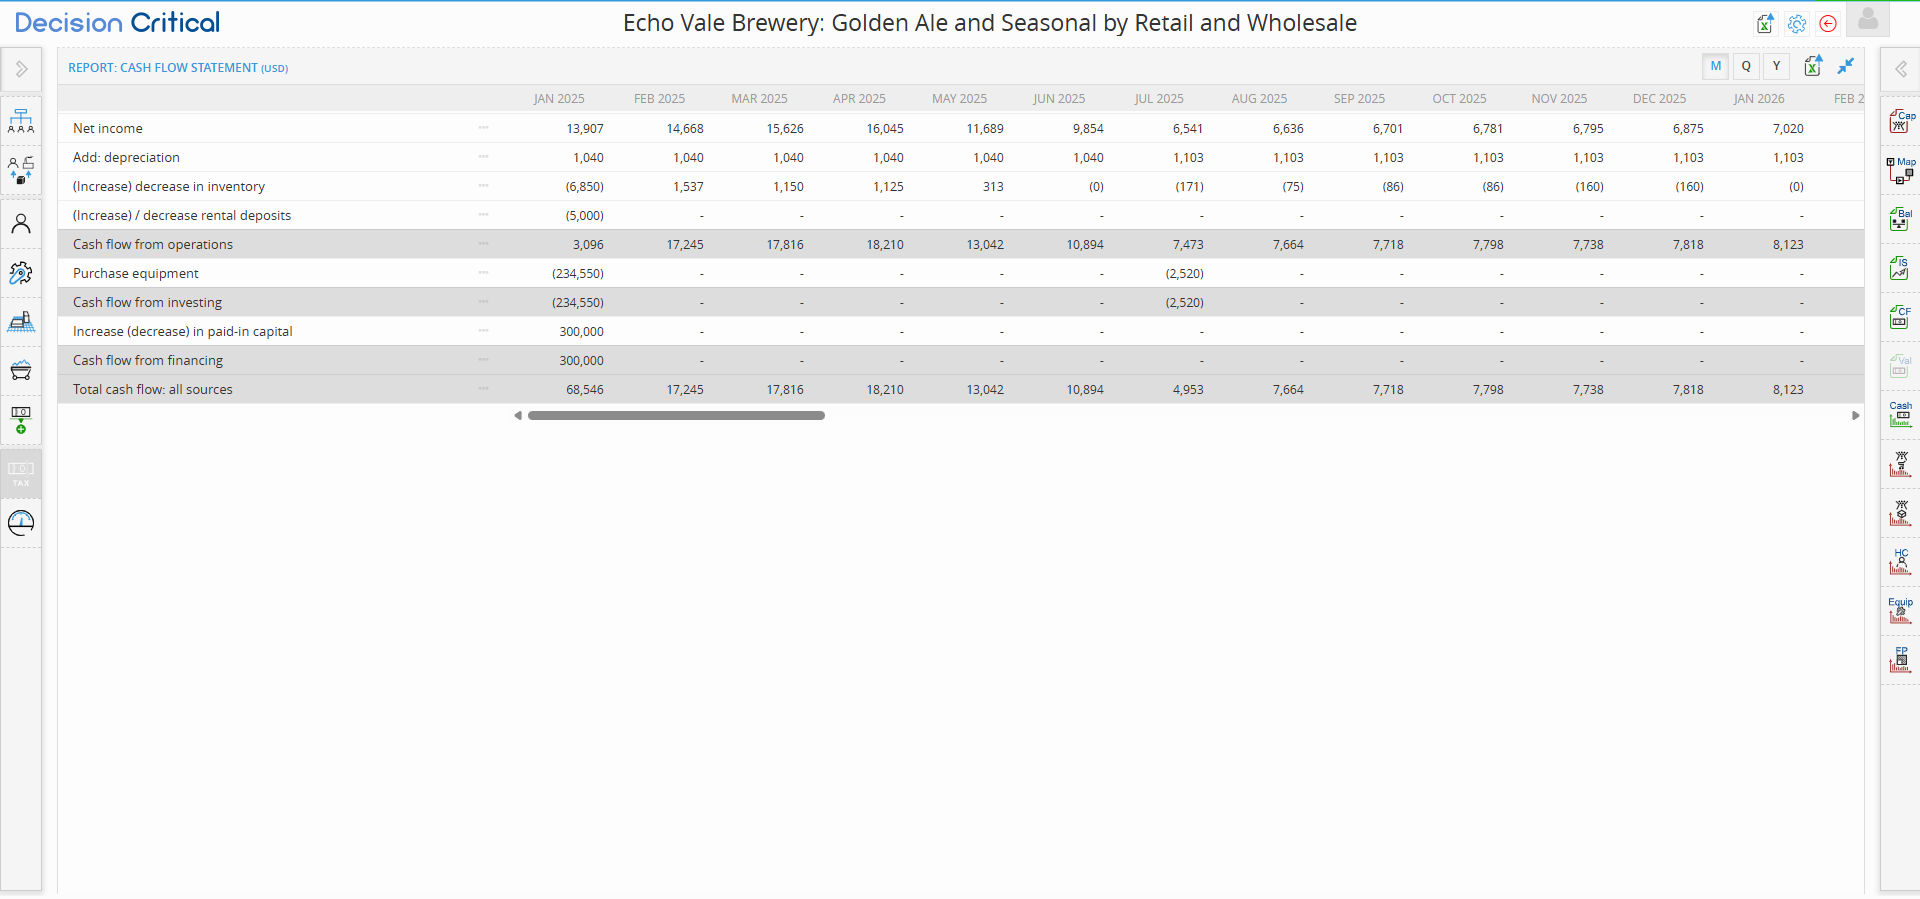
The Cash Flow Statement (CF) bridges the gap between your paper profit (Income Statement) and your actual bank account (Balance Sheet). It shows you exactly where your money is coming from and where it’s going—whether it's being tied up in inventory, spent on new brewery equipment, or provided by investors.
For operations and finance teams, this is the ultimate "reality check" to ensure your strategy doesn't run out of fuel.
Step-by-Step: Navigating the Cash Flow Statement
-
Open the Report: Click the CF (Cash Flow Statement) icon on the right-hand sidebar.
-
Toggle Your View: Use the M, Q, or Y buttons in the top right to switch between monthly, quarterly, or yearly cash trends.
-
Visualize Any Line (Ellipsis Button): Click the ellipsis button (...) on the far right of any row to open a visual Drill-Down Graph. This allows you to see the "peaks and valleys" of your cash movements over the life of the scenario.
-
Export Data: Click the Excel icon in the top-right corner to download your report data as a CSV or Excel file.
- Expand view: Click diagonal arrows to maximizes the report to fill your screen
Understanding the Three Pillars of Cash Flow
The statement is broken into three main sections that explain your company's movement:
-
Cash Flow from Operations: This is the money generated by your core business.
-
It starts with Net Income and adds back Depreciation (because you didn't actually "pay" cash for depreciation this month).
-
It also accounts for Inventory changes. If you buy more raw materials than you sell, your cash goes down even if your profit looks good.
-
-
Cash Flow from Investing: This tracks "Big Purchases."
-
When you see Purchase Equipment, this shows the actual cash leaving the business to buy machines, computers, or furniture.
-
-
Cash Flow from Financing: This tracks where you got your "Startup" or "Growth" money.
-
Increase in Paid-in Capital shows cash coming into the company from owners or outside investors.
-
Why "Total Cash Flow: All Sources" Matters
The bottom row, Total Cash Flow: All Sources, tells you the net result of all your activities for that period.
-
Positive Number: You added more cash to the bank than you spent.
-
Negative Number (in parentheses): You spent more cash than you brought in during that specific month.
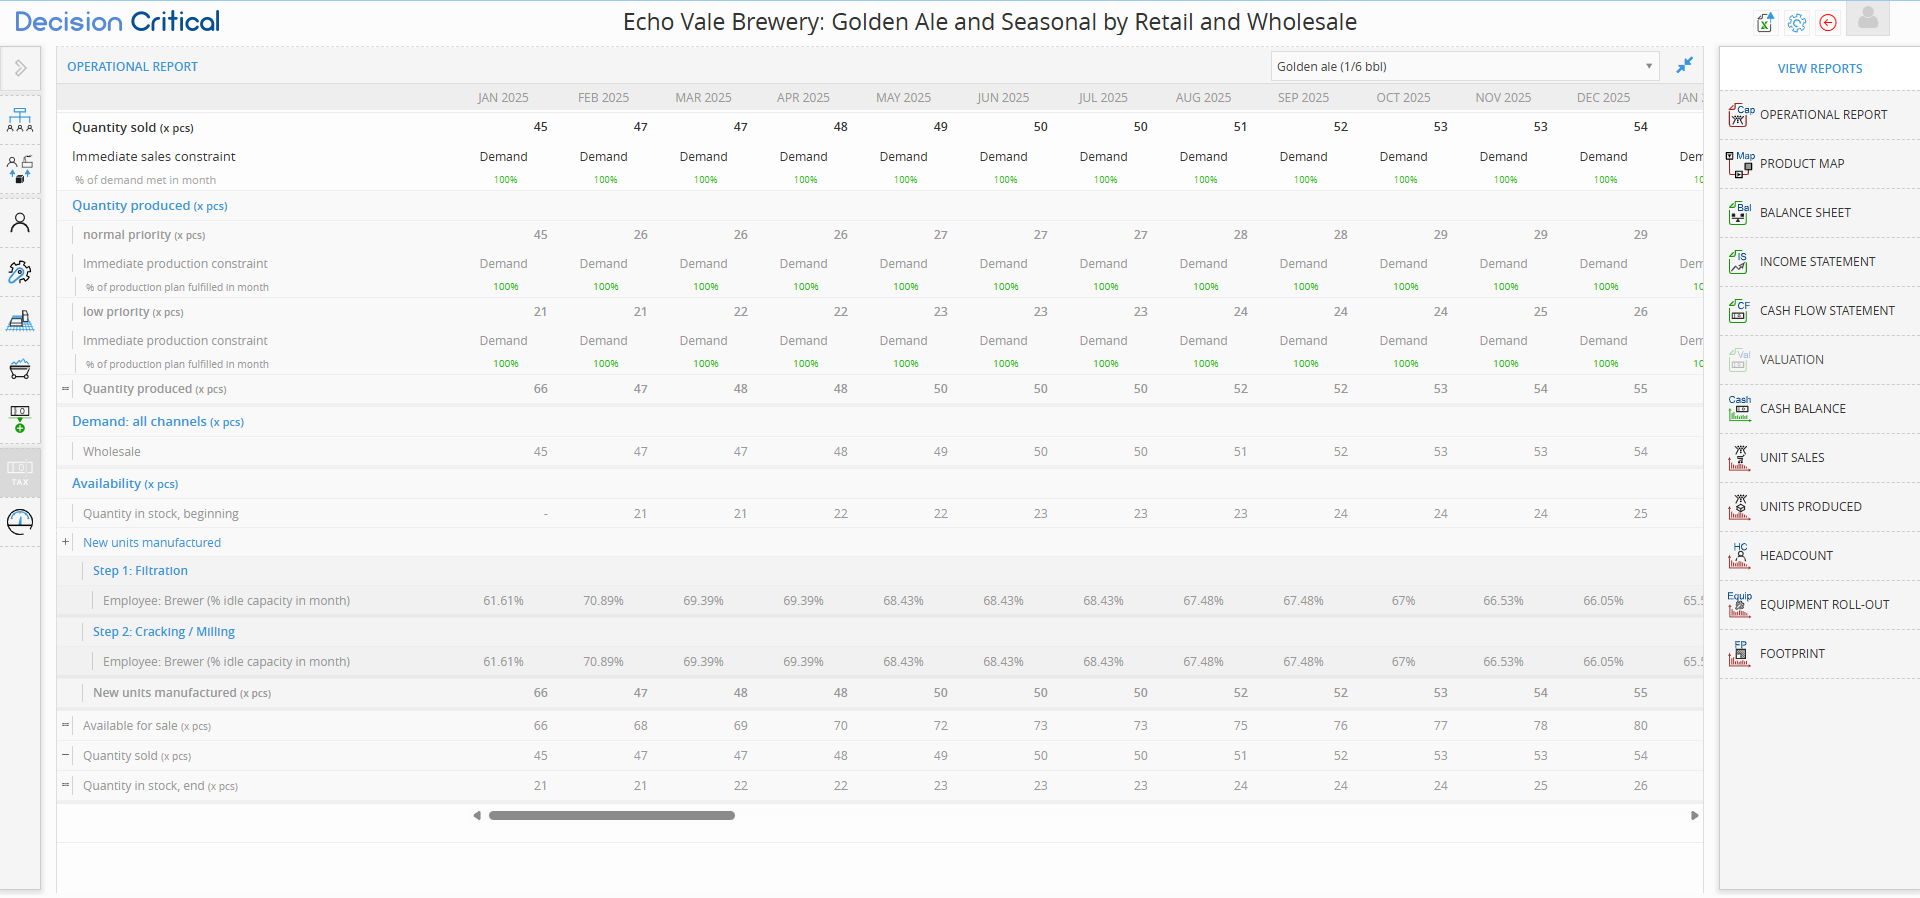
The Operational Report
While your financial statements show the dollar value of your business, the Operational Report tracks the "boots on the ground" reality. This report focuses on physical units—bottles, pints, or batches—to help you identify exactly where your production line meets your customer demand.
Whether you are tracking a Finished Product (ready for sale) or a Semi-Finished Product (a component used to make something else), this report is your primary tool for spotting bottlenecks.
Step-by-Step: Navigating the Operational Report
-
Open the Report: Click the Cap (Operational Report) icon on the right-hand sidebar.
-
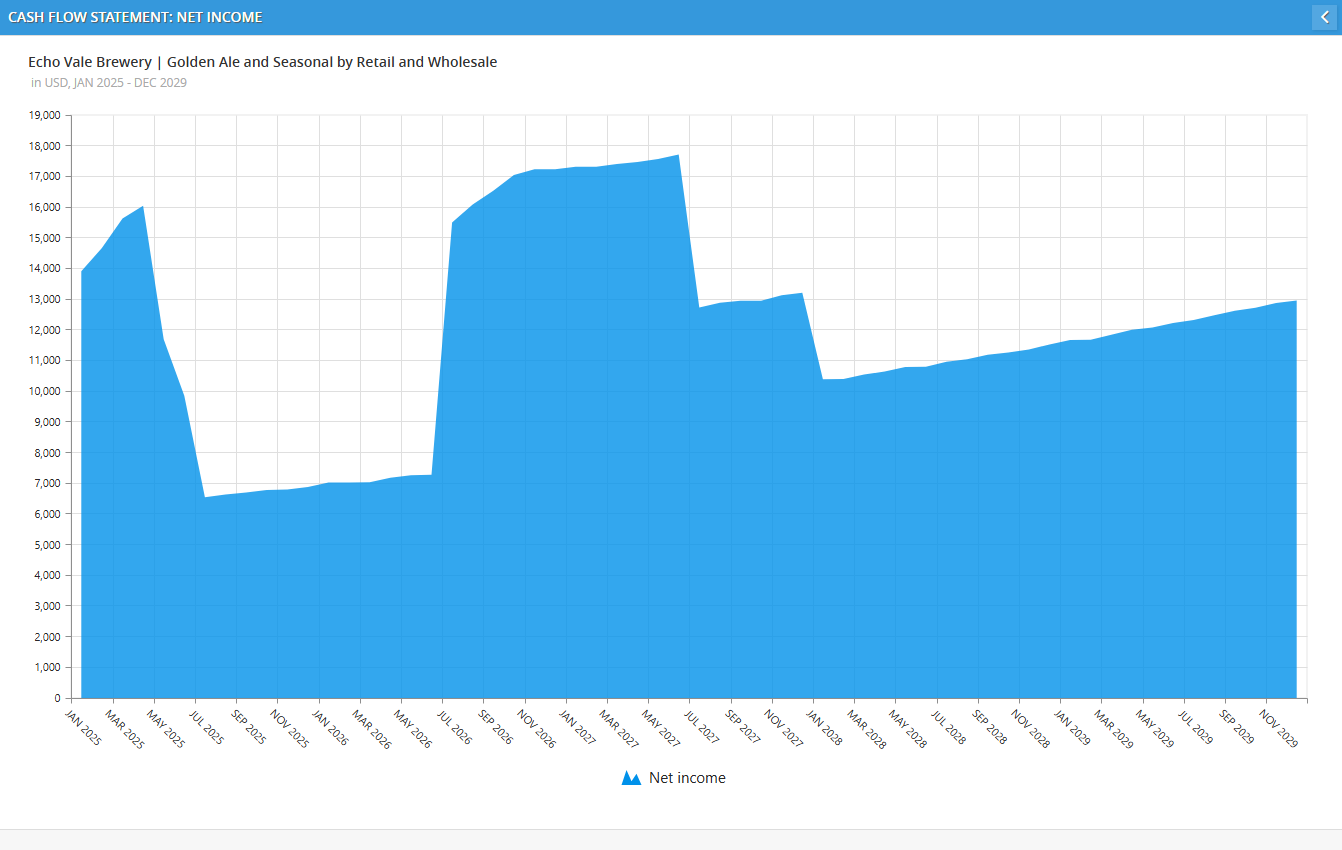
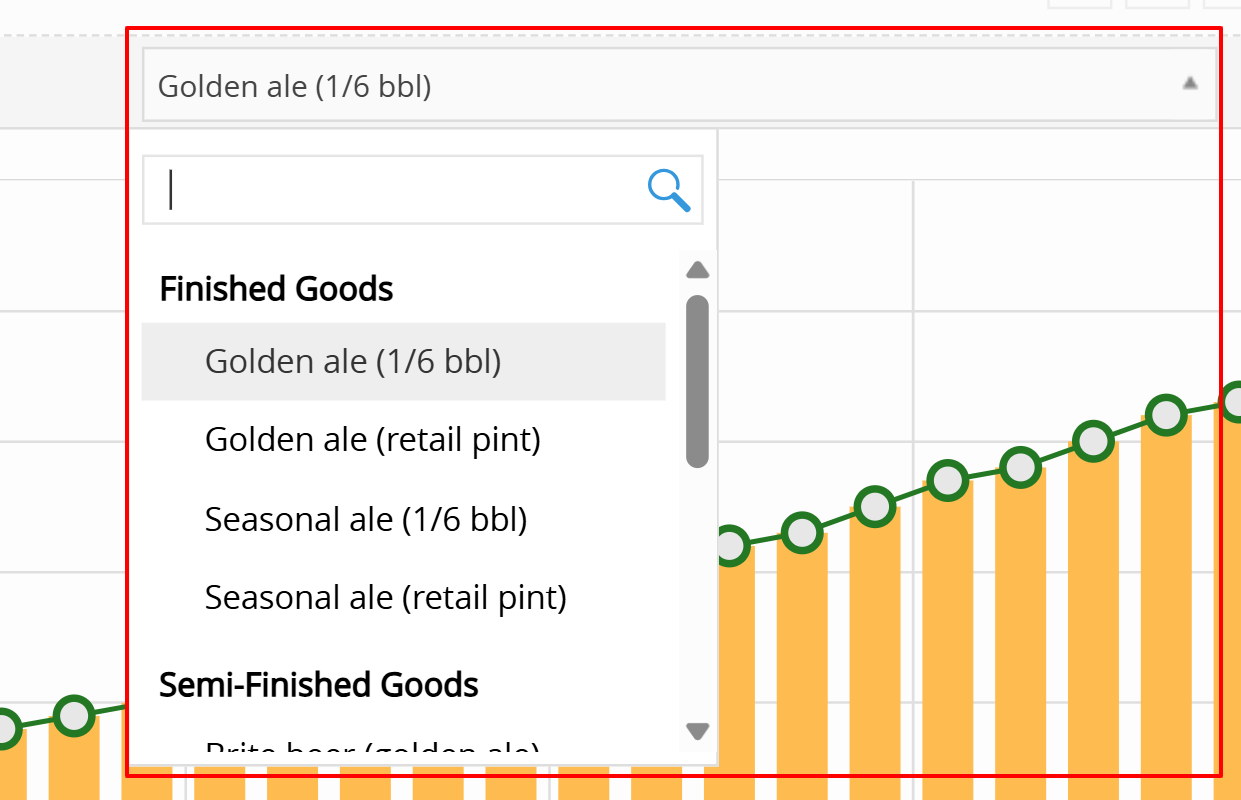
Select Your Product Type: Use the dropdown menu at the top right to choose between:
-
Finished Products: (e.g., Golden Ale 1/6 bbl) Tracked by Quantity sold.
-
Semi-Finished Products: (e.g., Brite Beer) Tracked by Quantity used in other products.
-
-
Check the Timeline: Switch between M, Q, or Y views to see your production cycles.
-
Deep-Dive Analysis:
-
Expand Categories (Blue Text): Click items in blue text to reveal sub-steps. For example, expanding New units manufactured reveals your specific production steps (e.g., Filtration or Cracking/Milling) and the idle capacity of the equipment or staff involved.
-
Visualize Any Line (Ellipsis Button): Click the ellipsis button (...) on the far right of any row to open a visual Drill-Down Graph.
-
-
Export Data: Click the Excel icon to download your unit data.
Finished vs. Semi-Finished: Reports Example
Since you can look through the report in the product-level, we going to how each different
1. Finished Products (The Revenue Generators)
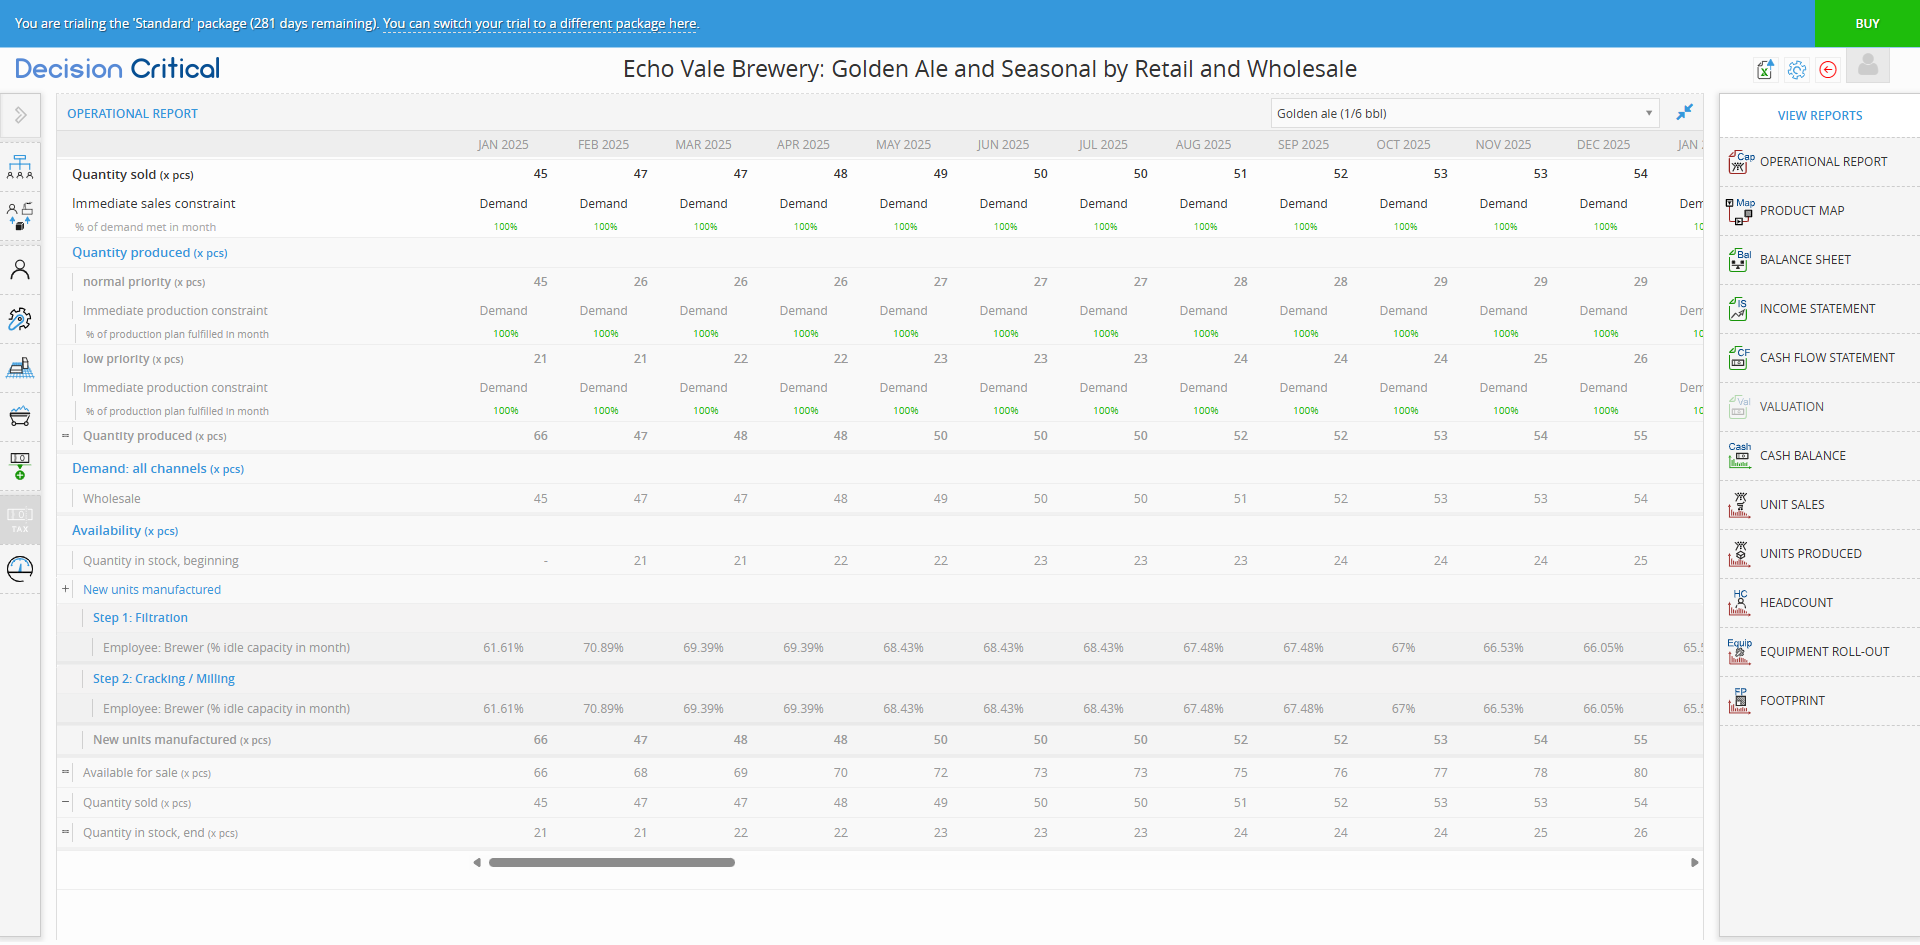
What they are: These are the final goods sold to your customers. They drive the "Sales" line on your Income Statement.
Example: Golden Ale (1/6 bbl Keg).
Key Metrics to Track:
-
Quantity Sold (x pcs): The actual number of units that left the building.
-
Immediate Sales Constraint: This is the "Governor" on your revenue.
-
Constraint = "Demand": Your production is perfect, but you have no more customers. Business Action: Increase marketing or open new sales channels.
-
Constraint = "Availability": You have customers, but no beer to give them. Business Action: Check your production capacity or raw material supply.
-
-
% of Demand Met: If this is 87%, you are losing 13% of your potential revenue every month because of an internal failure.
2. Semi-Finished Products (The Internal Components)
What they are: These are "Work in Progress" (WIP) items. They are brewed or made internally but never sold directly to a customer. They are "consumed" by a finished product.
Example: Brite Beer (Golden Ale). You need 1 batch of Brite Beer to fill multiple 1/6 bbl Kegs.
Key Metrics to Track:
-
Quantity Used in Other Products: This tracks the internal "hand-off." If this is lower than your "Requirement," your final packaging line (Kegging/Bottling) is sitting idle.
-
Immediate Constraint:
-
Constraint = "Requirement": Your internal supply chain is perfectly balanced.
-
Constraint = "Availability": Your "Downstream" product (the Keg) is hungry for more, but the "Upstream" process (the Brite Tank) can't keep up.
-
-
% of Requirement Met: This is your Internal Efficiency Score. Anything under 100% means your finished goods are being "starved" of components.
Valuation
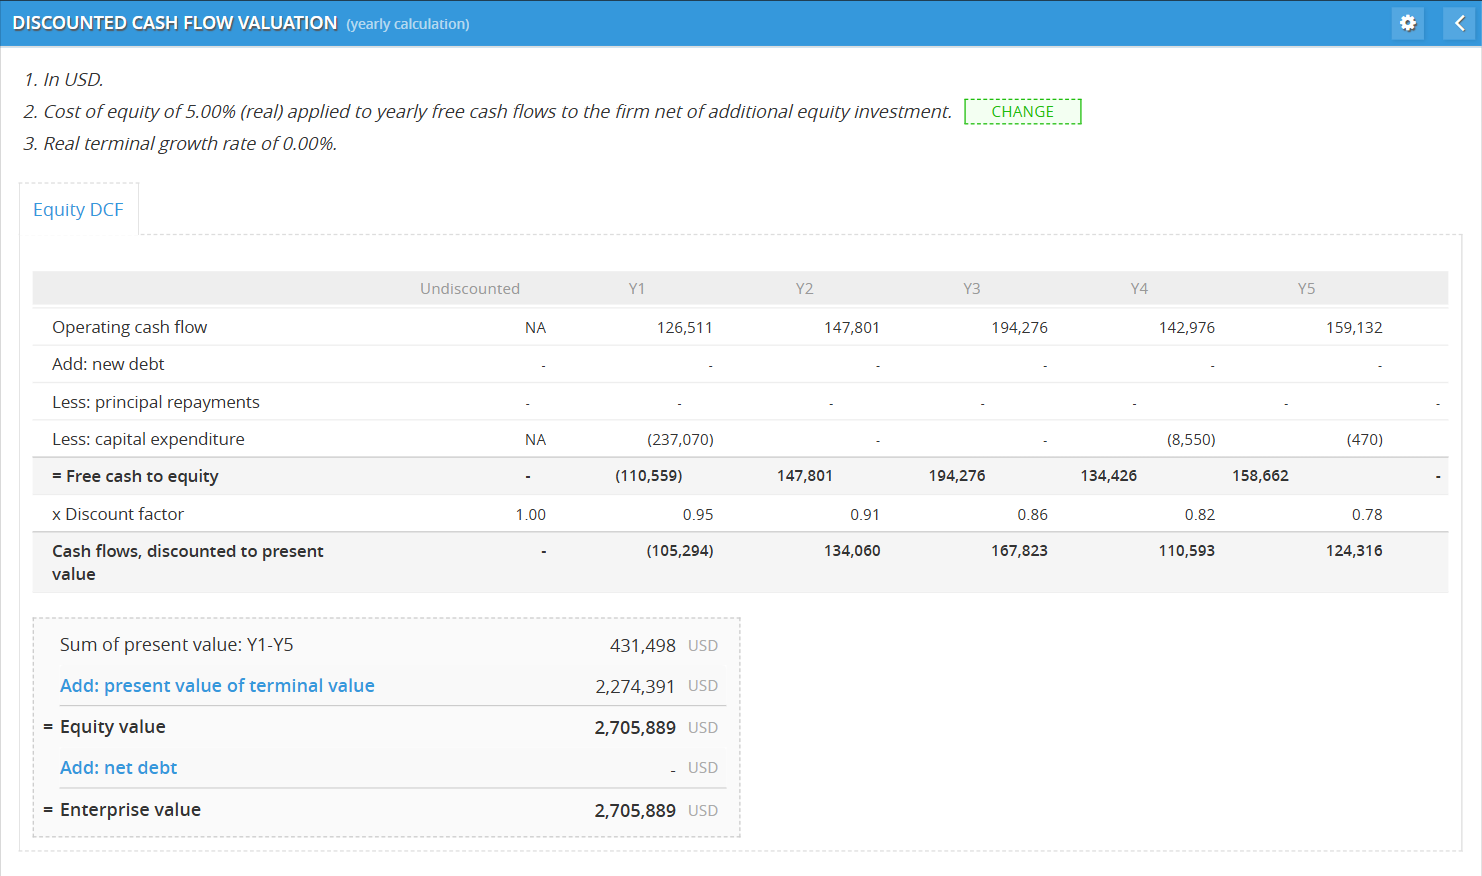
The Valuation module is the ultimate "Reality Check" for your business strategy. It calculates your company’s Intrinsic Value—what the business is worth today based on the cash it is expected to generate in the future.
By following this guide, you will learn how to use the Discounted Cash Flow (DCF) approach to determine if your scenario is actually creating wealth or just burning resources.
Step 1: Pre-Check for Solvency
Before running a valuation, you must ensure your company is financially viable.
-
The Action: Open the Cash Balance chart on the right-hand sidebar.
-
The Rule: If your cash balance drops below zero at any point, the scenario is insolvent.
-
The Impact: A valuation on a bankrupt company is often meaningless. If you are insolvent, go to the Financing tab and add investment or debt before proceeding.
Step 2: Accessing the Valuation Report
-
Click the Val (Valuation) icon on the right-hand sidebar.
-
The system will automatically pull your cash flow projections.
-
Use the M (Monthly) or Y (Yearly) buttons in the top right to choose your analysis timeframe.
Step 3: Setting the "Cost of Equity"
The Cost of Equity is the "Discount Rate." It represents the return investors expect in exchange for the risk of putting money into your business. Decision Critical offers three ways to set this:
Method 1: Direct Input (The Quickest Way)
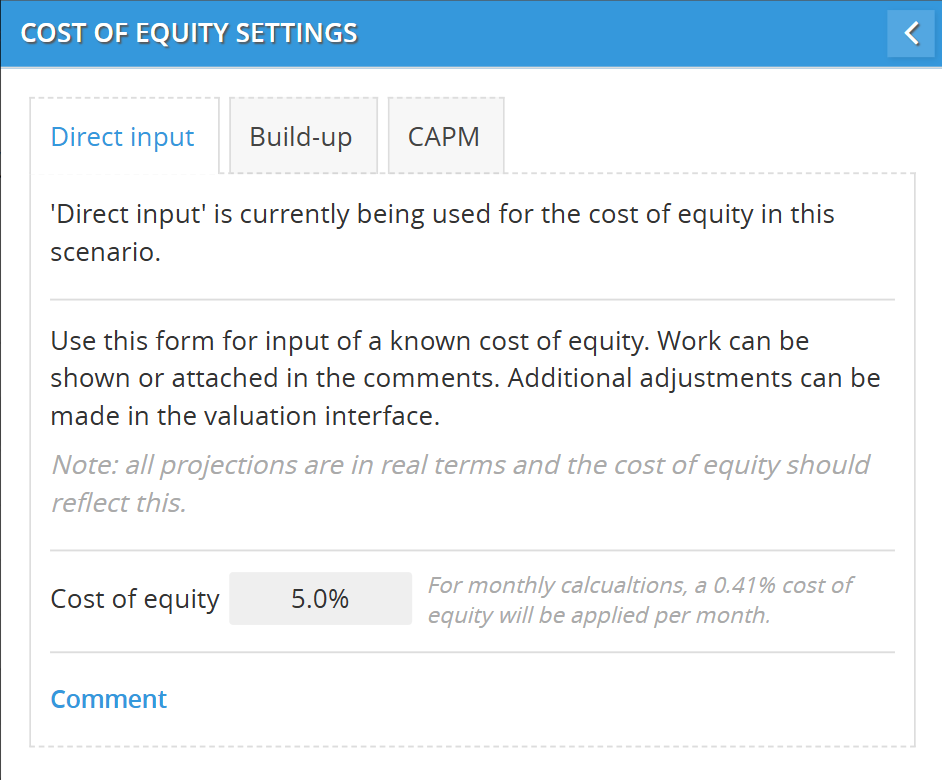
Use this if you already have a target return in mind or if a senior stakeholder has provided a specific discount rate (e.g., "We need to see a 12% return").
How-To Steps:
-
Open Valuation: Click the Val icon on the right-hand sidebar.
-
Select Tab: Click the Direct input tab at the top of the settings window.
-
Enter Rate: Type your desired percentage into the Cost of Equity field (e.g., 15.0%).
-
Add Context: Use the Comment section to note why this specific rate was chosen (e.g., "Internal hurdle rate for 2026 brewery projects").
-
Save: Click the blue back arrow (<) in the top right of the window to apply the settings.
Method 2: Build-Up Method (The Risk Stacker)
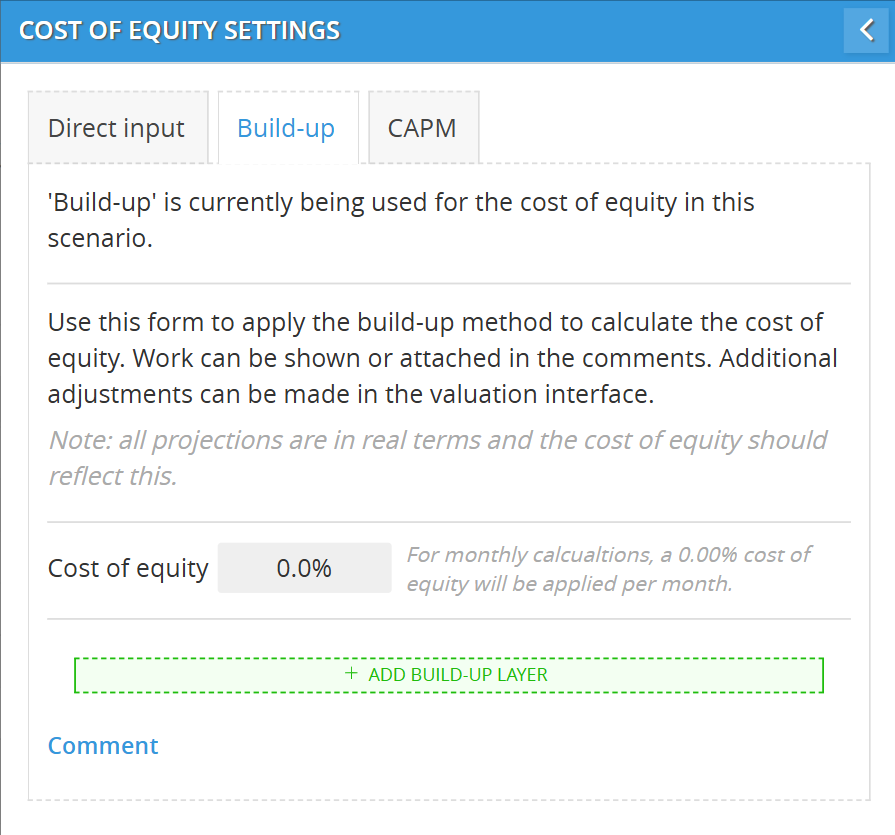
Use this for private companies or startups where you don't have stock market data. This method "builds" a custom rate by adding different layers of risk together.
How-To Steps:
-
Select Tab: Click the Build-up tab in the Valuation settings.
-
Input Risk-Free Rate: Enter the current yield on long-term government bonds (this is your "base" rate).
-
Add Equity Risk Premium: Enter the extra return expected for investing in any stock vs. a safe bond.
-
Add Size Premium: If your business is small, investors demand a higher return. Enter a percentage here to account for "Small Business Risk."
-
Add Specific Company Risk: Enter a percentage for risks unique to your business (e.g., a one-of-a-kind craft beer recipe that might not catch on).
-
Review Total: The system will sum these up at the top of the window to show your final Cost of Equity.
Method 3: CAPM (The Scientific Market Standard)
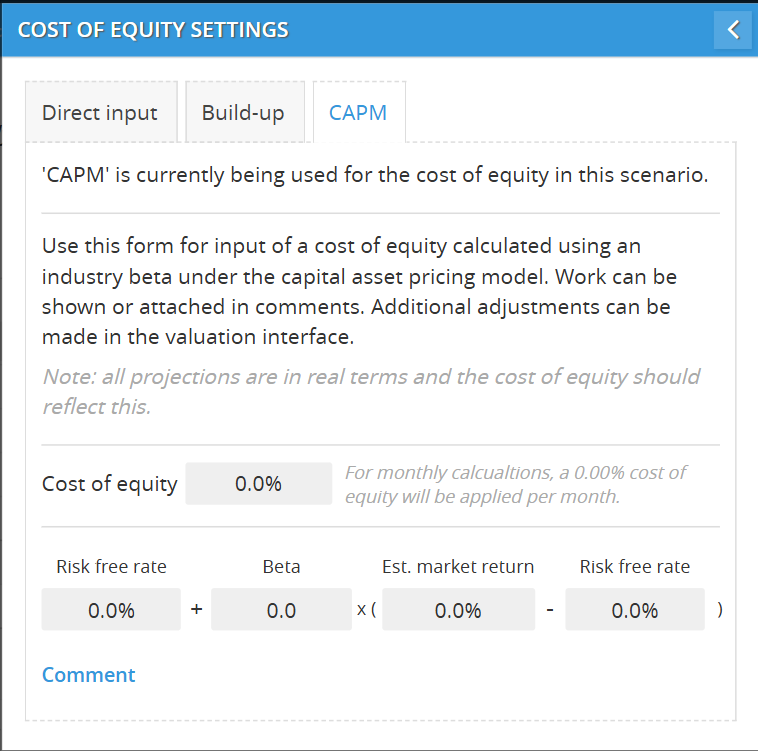
The Capital Asset Pricing Model (CAPM) is used by finance pros to find a fair rate based on how your industry moves compared to the overall stock market.
How-To Steps:
-
Select Tab: Click the CAPM tab in the settings.
-
Input Risk-Free Rate: Enter the "Safe Rate" (e.g., 10-year Treasury bond yield).
-
Input Beta: This is the most important part.
-
Enter 1.0 if your business risk is exactly average.
-
Enter lower (e.g., 0.8) if your brewery is very stable.
-
Enter higher (e.g., 1.4) if your business is volatile.
-
-
Input Est. Market Return: Enter what the total stock market is expected to return (usually 8%–10%).
-
System Calculation: The software will automatically solve this equation for you:
Cost of Equity = Risk Free Rate + beta times (Market Return - Risk Free Rate)
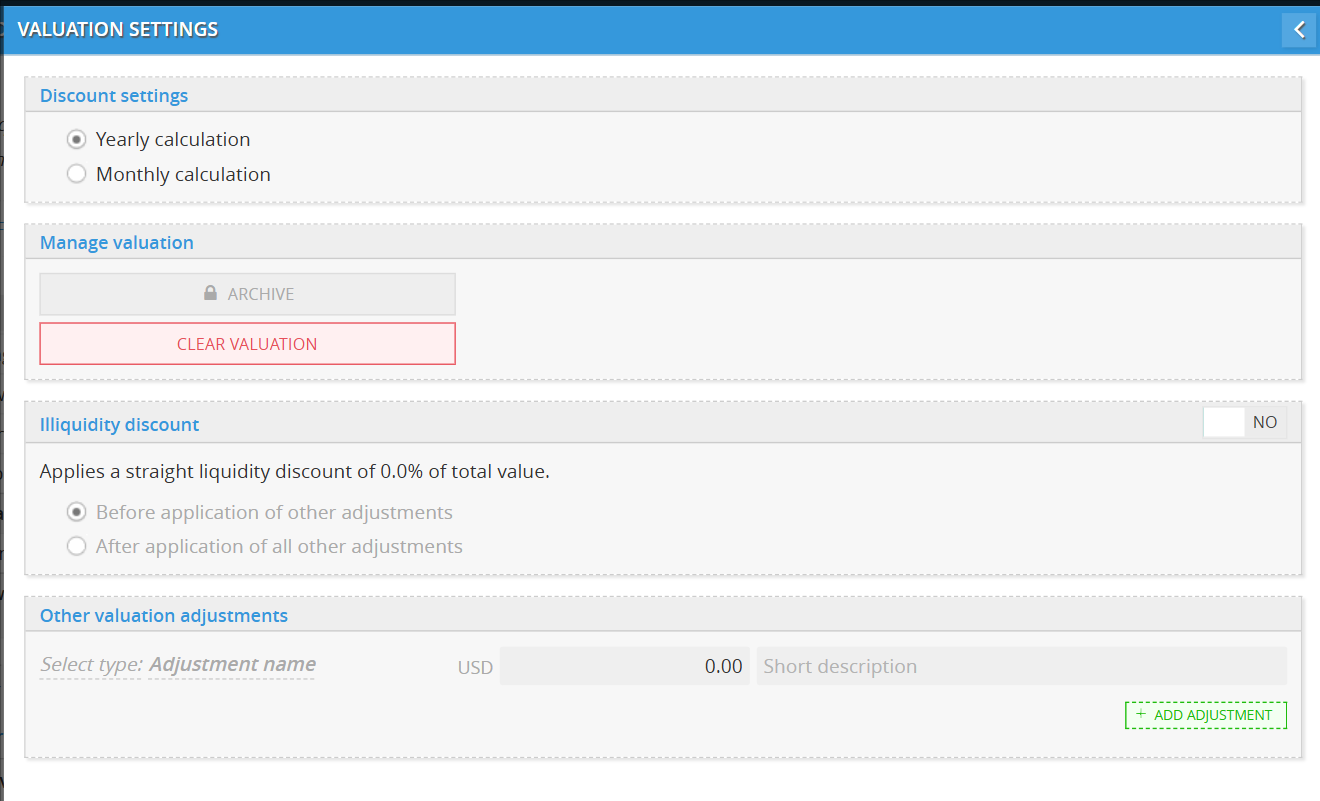
Additional Settings
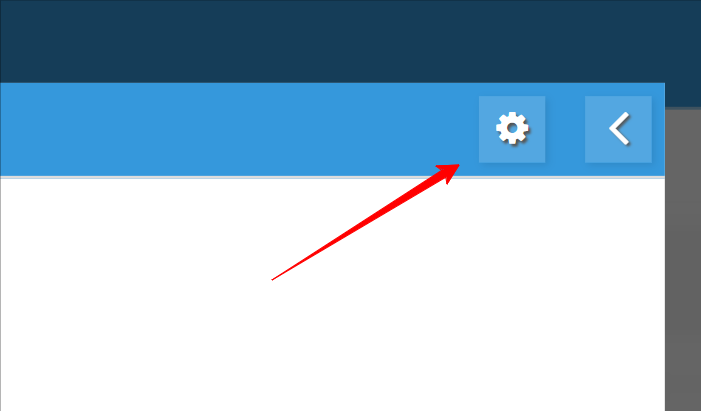
Open Settings: Inside the Valuation report, click the Gear icon
Select Calculation Frequency: Choose between Yearly (strategic view) or Monthly (seasonal view) calculations.
Apply Illiquidity Discount: If your business is private and hard to sell quickly, toggle this to YES.
Enter %: Input the discount rate (e.g., 20%).
Choose Logic: Select Before or After application of other adjustments to determine when the percentage is deducted from the total.
Add Custom Adjustments: Use + ADD ADJUSTMENT to include specific dollar values (USD) for items not in your cash flow (e.g., brand value or pending legal costs).
Save: Click the blue back arrow (<) to refresh the report.
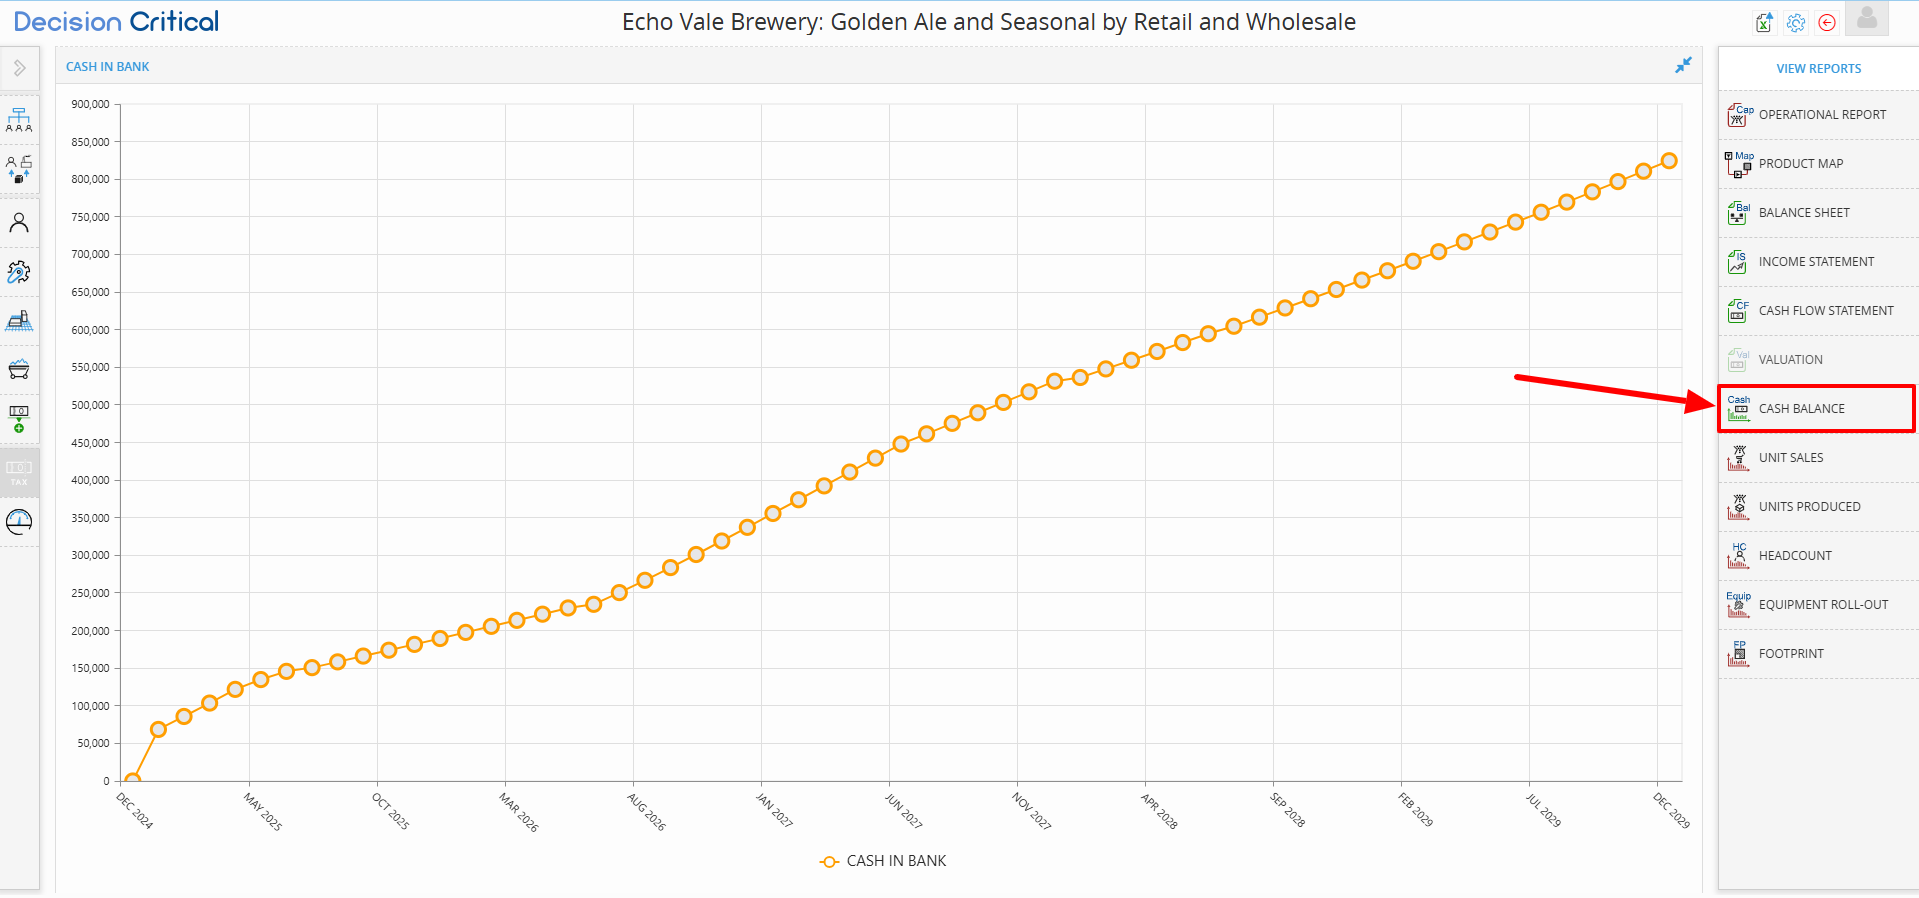
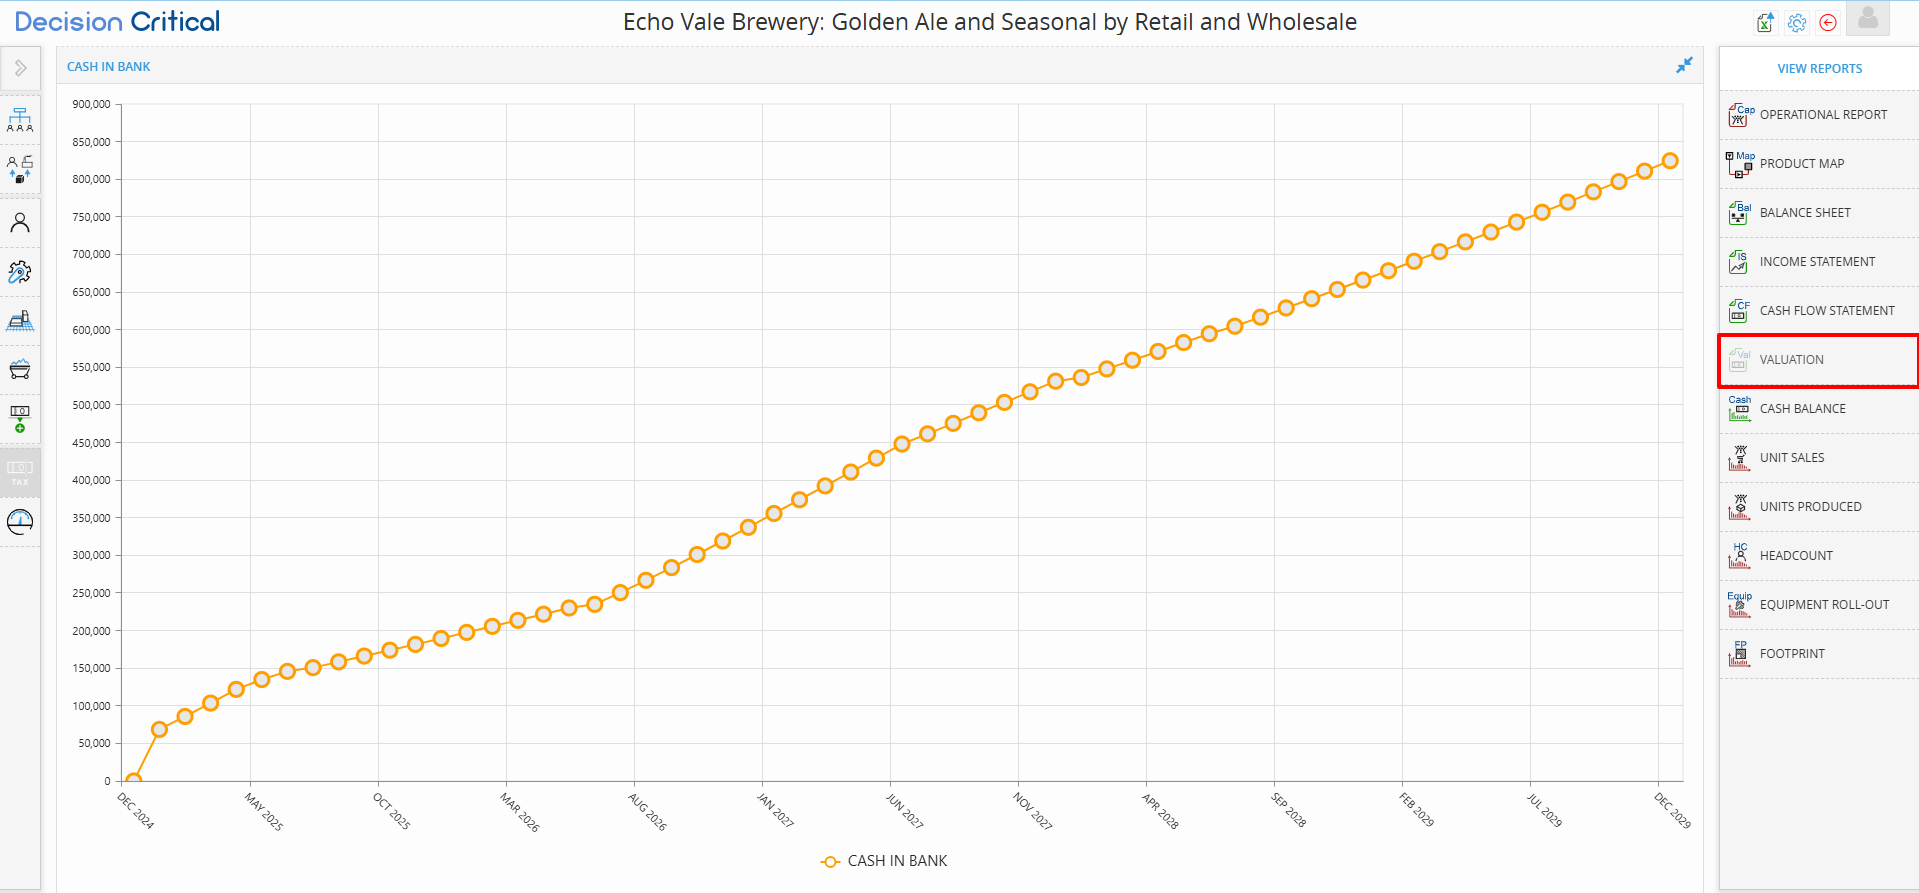
The Cash Balance Report
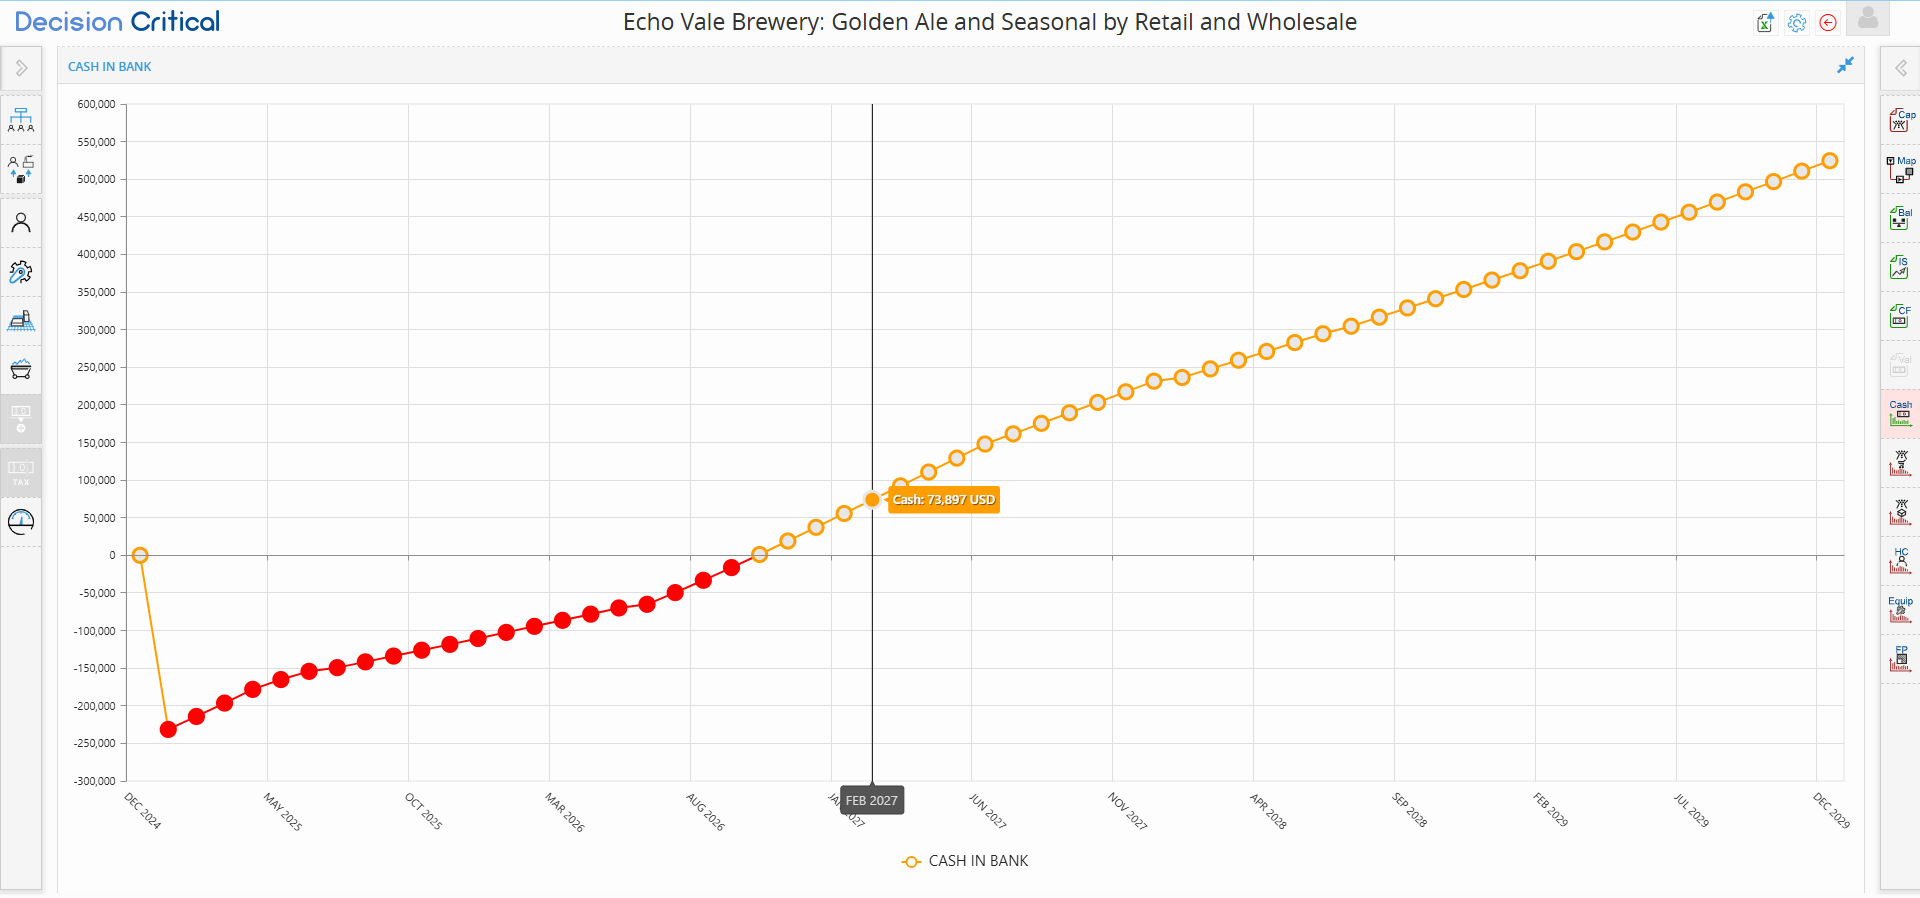
In Decision Critical, the Cash Balance report is your scenario’s "survival chart." While the Income Statement shows if you are making a profit on paper, this report shows if you actually have enough money in the bank to pay your bills.
This is the most important report for ensuring your business is solvent. If your cash drops below zero, your strategy is at risk, and your Valuation will not calculate correctly.
Step-by-Step: Navigating the Cash Balance Report
-
Open the Report: Click the Cash (Cash Balance) icon on the right-hand sidebar.
-
Check the "Minimum Cash Balance": This row tells you the lowest point your bank account hits in each year. If this is negative (in parentheses), you have an insolvency problem.
-
Analyze the Chart: Look at the Cash in Bank graph.
-
Red Dots: Represent Insolvency. Your business has run out of cash during these months.
-
Orange Dots: Represent Solvency. Your business has a positive cash balance.
-
-
Hover for Details: Move your mouse over any dot to see the exact cash balance for that specific month (e.g., "Sep 2026: -16,284 USD").
-
Full Screen: Click the Expand icon in the top right of the chart to see the full timeline from start to finish.
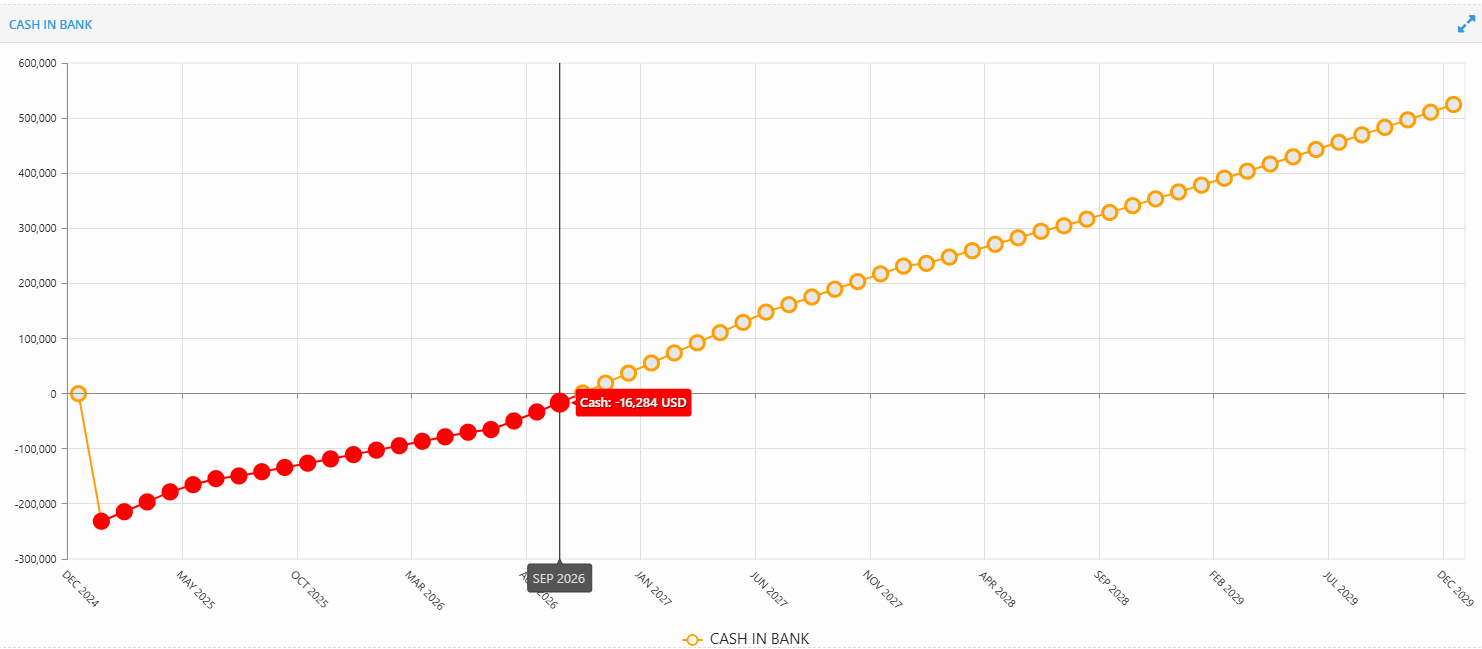
Why the Red Dots Matter (Insolvency)
If your chart shows Red Dots, as seen in this chart from Dec 2024 through Sep 2026, it means your business is technically bankrupt during those months.
-
The Cause: Usually caused by high "Upfront Costs" (like buying $237,070 in equipment) before you have enough sales to cover the bill.
-
The Fix: You need to bridge this "Cash Gap." Navigate to the Financing tab on the left sidebar and add Equity Investment or Debt to cover the negative balance until the dots turn orange.
My Profit is positive, so why is my Cash Balance red?
Profit and Cash are not the same! You might be profitable, but if you spent all your cash on Inventory or Equipment, or if your customers haven't paid their Invoices yet, your cash balance will stay red.
Can I run a Valuation if I have red dots?
No. A company that is out of cash has no intrinsic value in a DCF model. You must fix the insolvency (turn the dots orange) before the Valuation (Val) module can give you a "Sticker Price."
Why does the chart start so low in Year 1?
Most startups or new projects have a "J-Curve." You spend money on staff and machines first (the dip), and then sales catch up (the rise). Your goal is to ensure the "dip" never goes so low that you can't pay your employees.
The Unit Sales Report
In Decision Critical, the Unit Sales report is a visual "stress test" for your supply chain. It illustrates the fundamental business logic that your actual sales are always the lesser of two things: the amount of product customers want (Demand) or the amount of product you actually have (Availability).
This guide will help you identify "lost revenue" and determine if you need to ramp up production or find more customers.
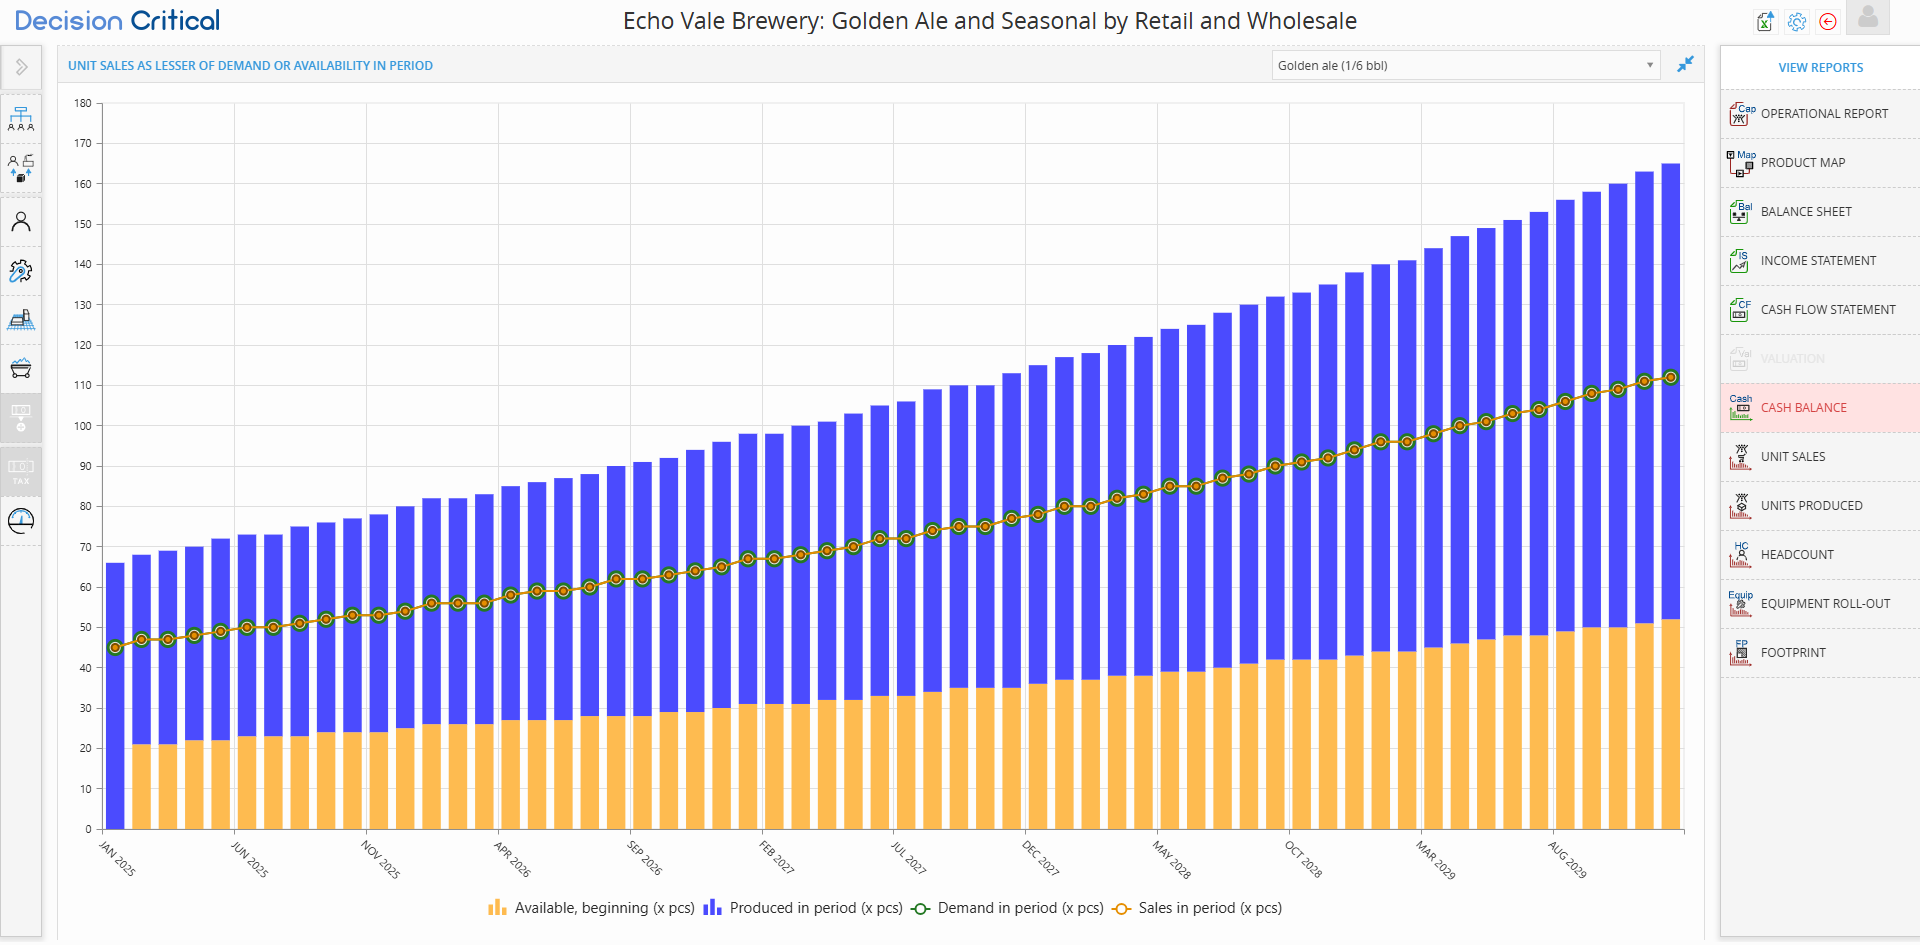
Step-by-Step: Reading the Unit Sales Chart
-
Open the Report: Click the Unit Sales icon on the right-hand sidebar.
-
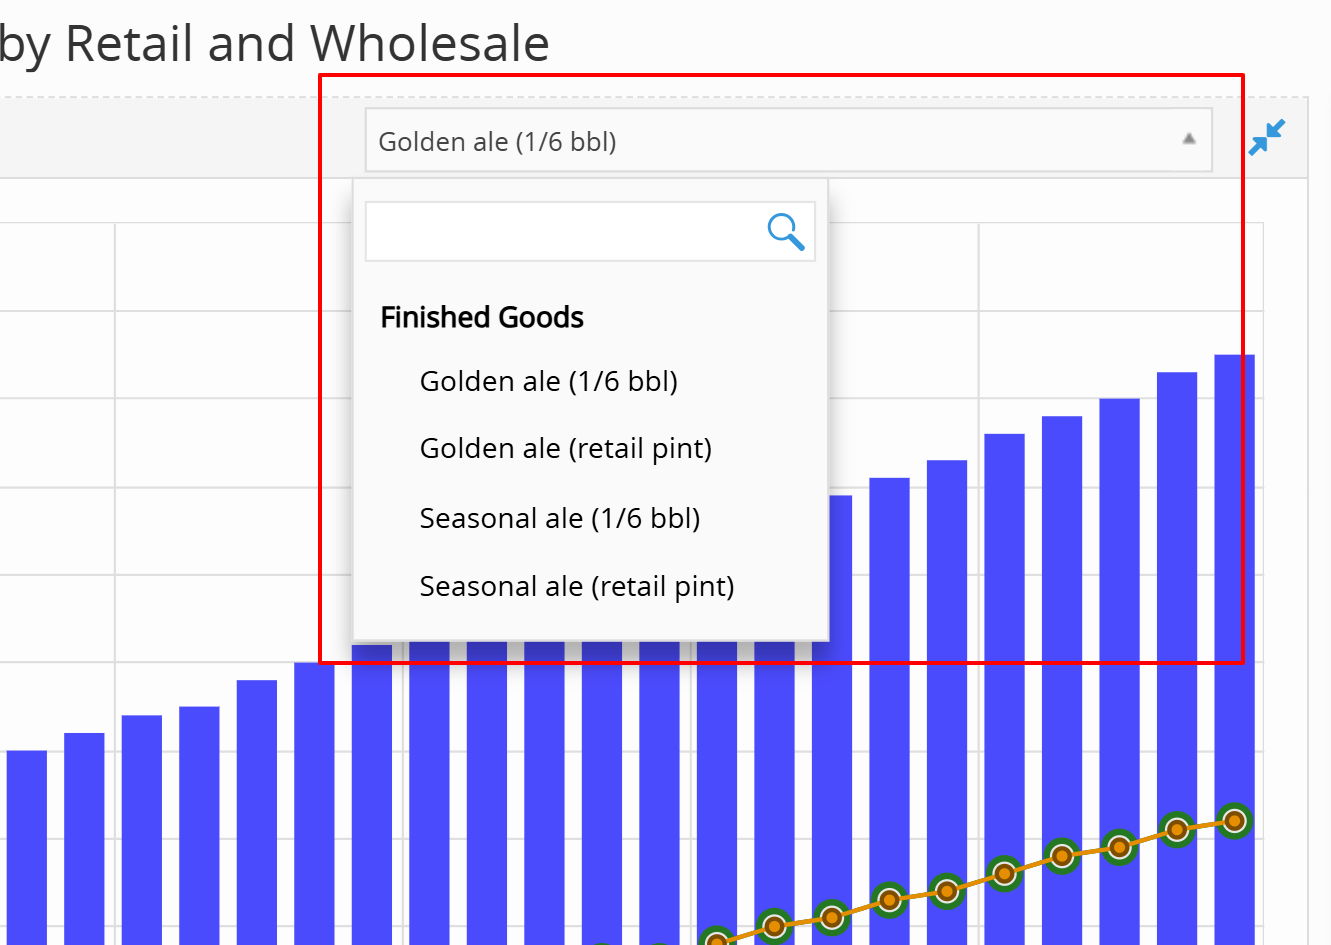
Select Your Product: Use the dropdown menu at the top right to filter by a specific product (e.g., Golden Ale 1/6 bbl).
-
Identify the Bars (Supply):
-
Orange Bars: Available, beginning — Stock you already had in the warehouse at the start of the month.
-
Blue Bars: Produced in period — New units your team manufactured this month.
-
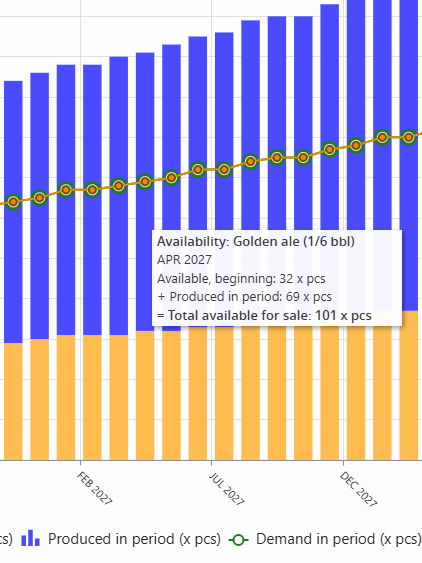
Total Height: The sum of the Orange and Blue bars represents your Total Availability.
-
-
Identify the Lines (Movement):
-
Green Line: Demand in period — How many units the market wants to buy.
-
Orange Line: Sales in period — The actual units sold.
-
-
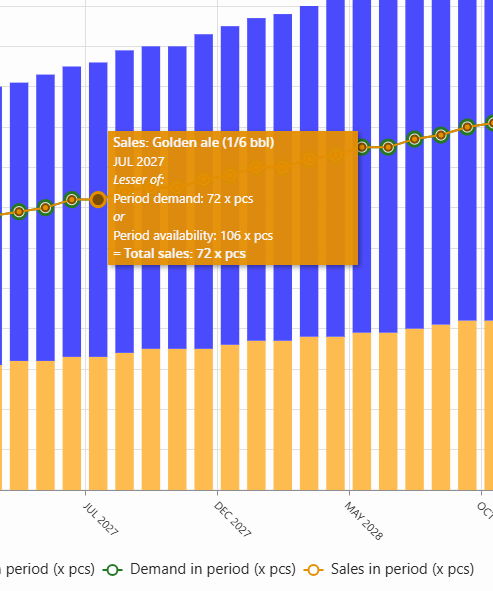
Hover for Tooltips: As seen in your images, hovering over the chart reveals the exact "Lesser-of" calculation for that month (e.g., JUL 2027: Demand (72) vs. Availability (106) = Sales (72)).
The "Lesser-Of" Logic: Interpreting the Gaps
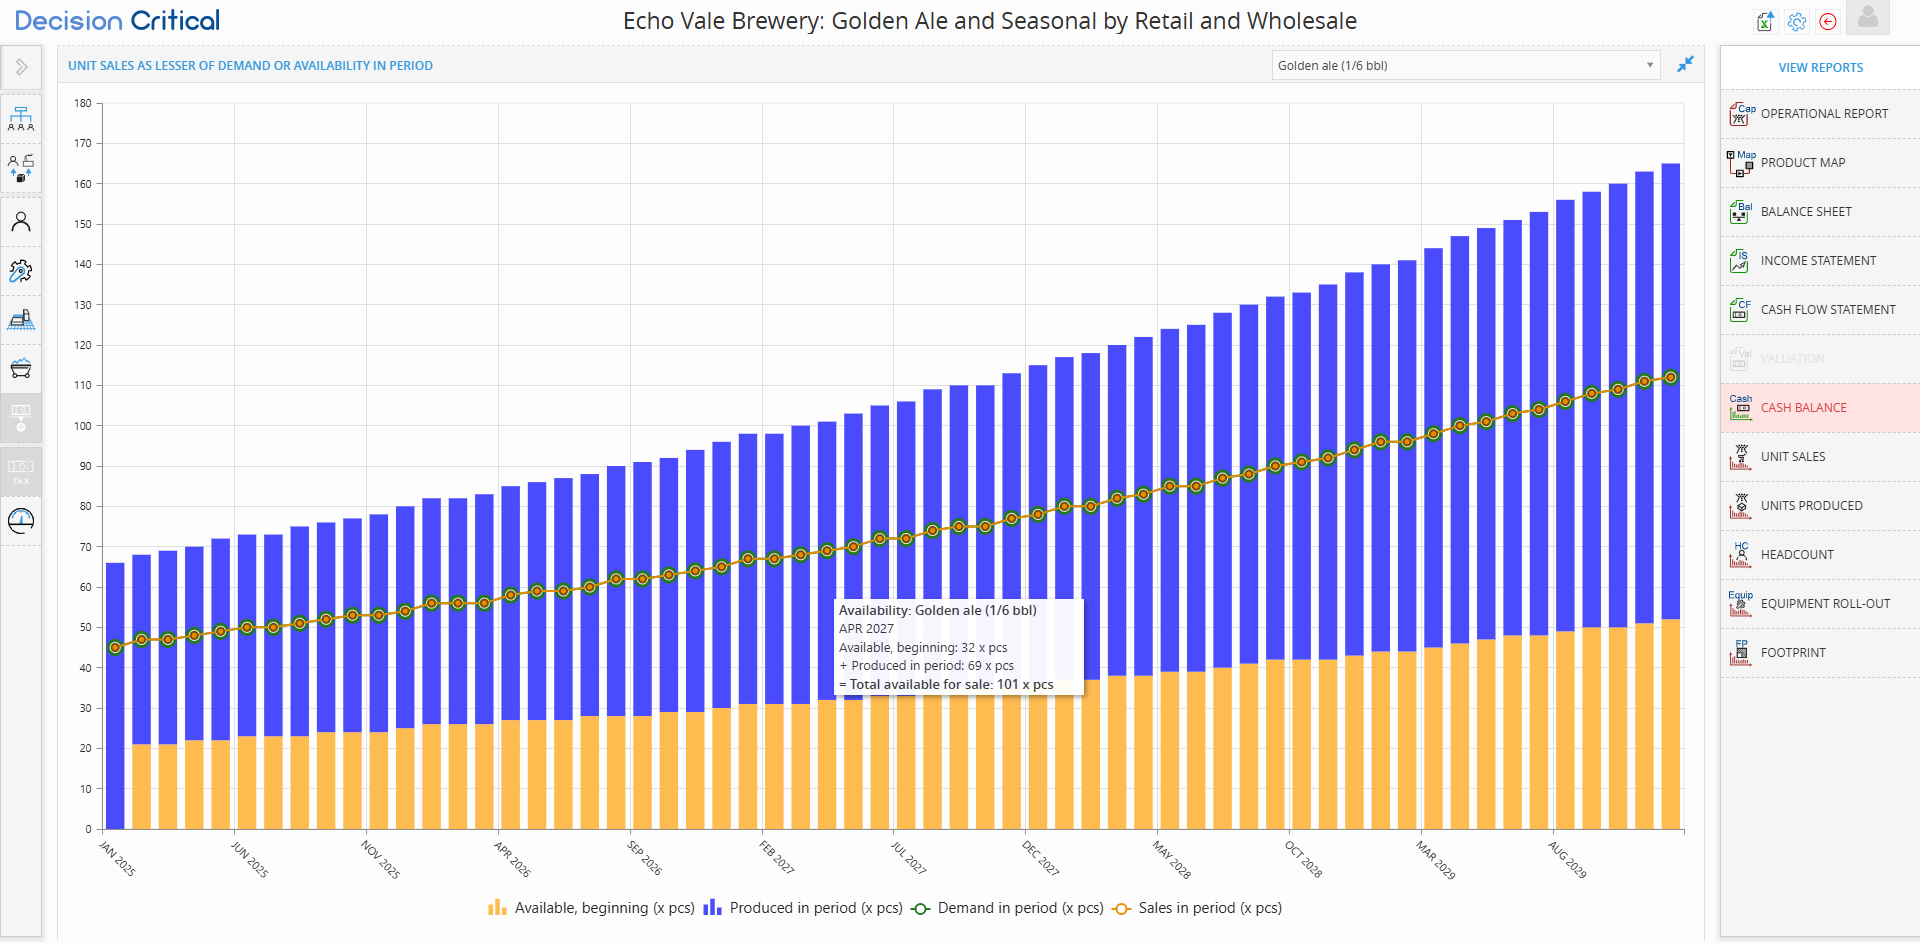
The goal of a perfectly optimized business is to have the Orange Line (Sales) sit exactly on top of the Green Line (Demand).
| Scenario | What it looks like... | Business Meaning |
| Demand > Availability | The Green line is higher than the Orange line. | Stockout: You are losing money because you aren't making enough product to meet demand. |
| Availability > Demand | The bars are much higher than the Orange line. | Overstock: Your production is fine, but you have too much cash tied up in sitting inventory. |
| The "Perfect" Fit | The Orange line follows the Green line perfectly. | Optimized: You are fulfilling 100% of demand without excessive waste. |
Why is my Orange line flat even though my Green line is going up?
This is a classic Bottleneck. It means your demand is growing, but your production (Blue bars) has hit a hard limit. You likely need more equipment or more staff hours to "lift" the orange line.
How do I increase the Green line?
The Green line is driven by your Product Assumptions. To move it up, you need to increase your "Market Demand" settings or add new sales channels (e.g., adding a "Retail" channel to your "Wholesale" business).
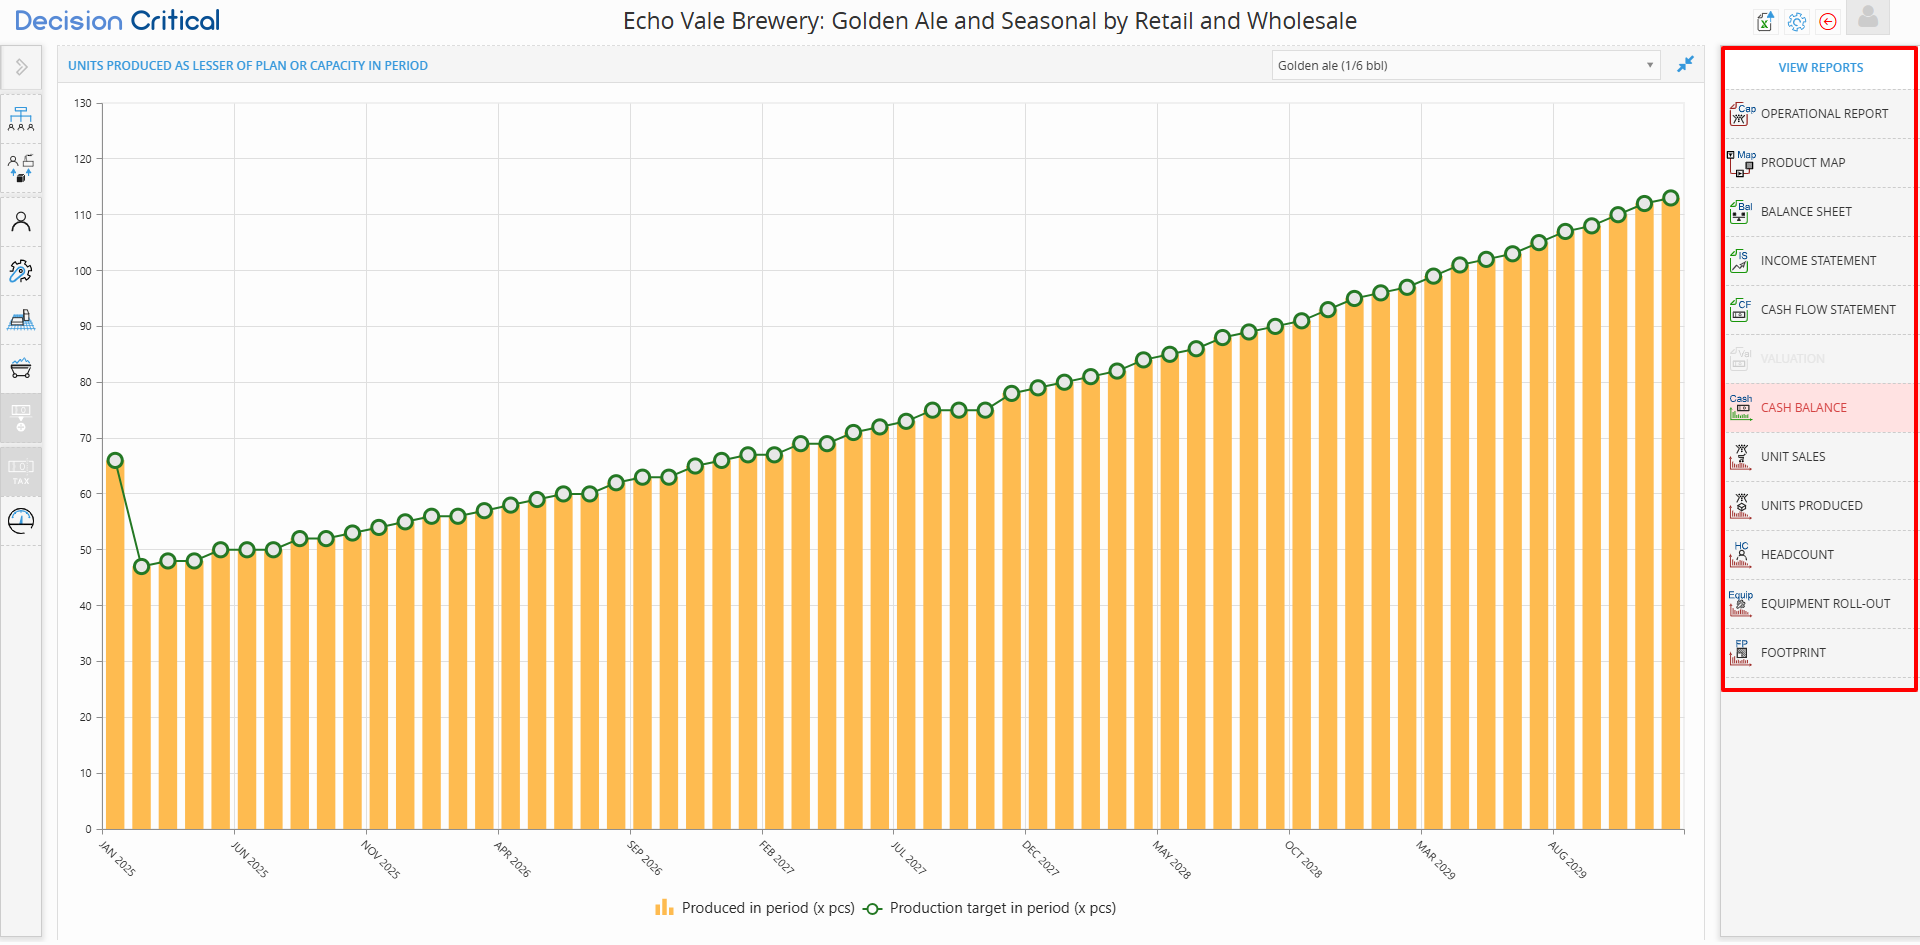
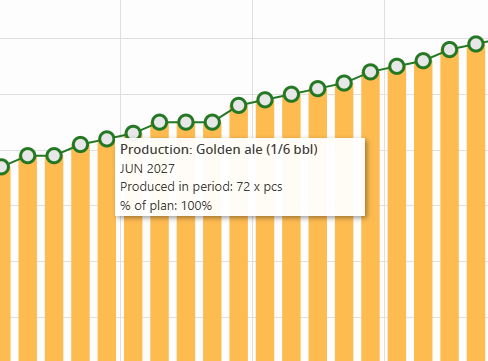
The Units Produced Report

In Decision Critical, the Units Produced report is a forecasted diagnostic tool that shows how well your facility is meeting its goals. It visualizes the relationship between your Production Target (what you want to make) and your Actual Capacity (what your staff and equipment are physically capable of making).
This report operates on a simple rule: your output is always the lesser of your plan or your capacity.
Step-by-Step: Reviewing Production Performance
-
Open the Report: Click the Units Produced icon on the right-hand sidebar.
-
Select Your Product: Use the dropdown menu at the top right to focus on a specific item (e.g., Golden ale (1/6 bbl)).
-
Identify the Target (The Plan):
-
Green Line: Represents your Production Target. This is the amount the system tries to produce to fulfill demand and inventory goals.
-
-
Identify the Output (The Result):
-
Orange Bars: Represent the Produced in period. This is the actual number of units the system successfully manufactured.
-
Interpreting the "Gap"
In a perfectly balanced scenario, your orange bars will touch the green line every month. If there is a gap, it tells you exactly where your operations are failing.
| If you see... | The Business Meaning | The Fix |
| Bar = Line (100% of Plan) | Optimal: Your staff and machines are sufficient to meet your current production goals. | Monitor Idle Capacity in the Operational Report to see how much room you have for future growth. |
| Bar < Line (<100% of Plan) | Bottleneck: You want to produce more, but you lack the physical resources (labor or equipment) to do so. | Check the Headcount or Equipment Roll-out reports to see which resource is maxed out. |
| Line is Flat/Zero | Planning Issue: You haven't set a production target or your "Automatic" load setting has no demand to fulfill. | Check your Product Assumptions to ensure you have active demand or a manual production plan. |
The Headcount Report
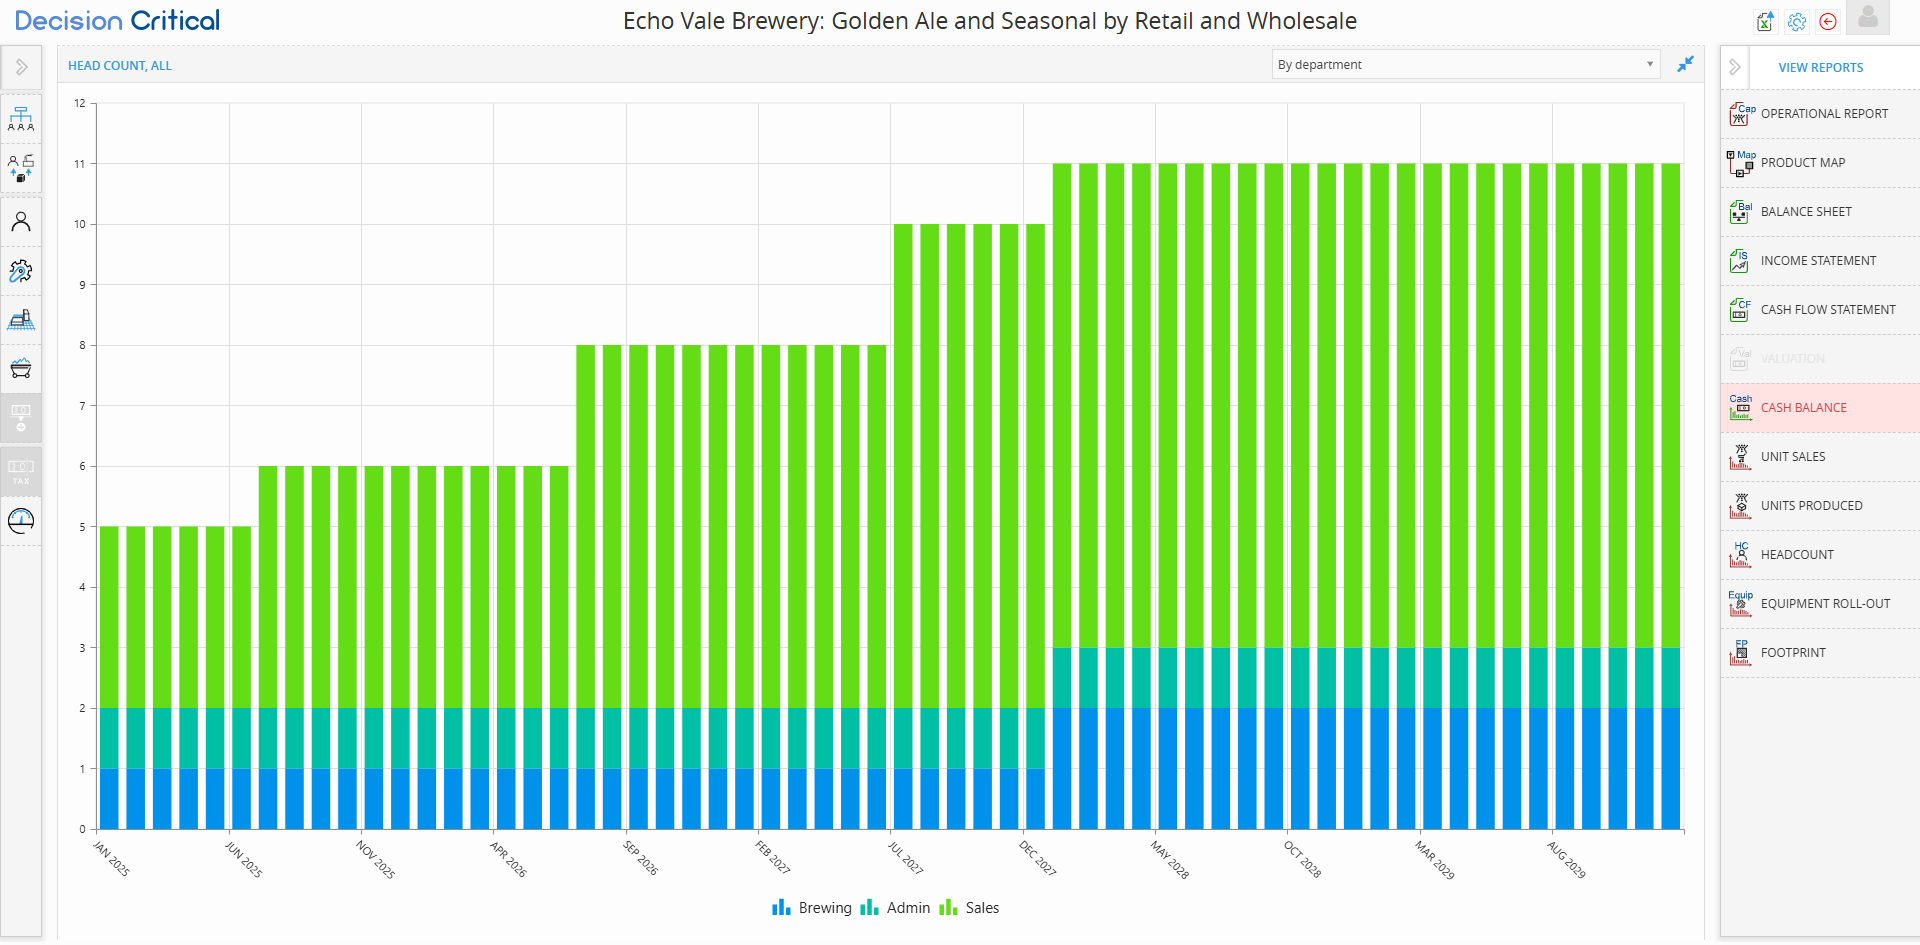
In Decision Critical, the Headcount report allows you to track the growth of your workforce over time. People are often your biggest expense and your most valuable asset; this report ensures that your hiring plan aligns with your production goals and financial capacity.
This guide will show you how to analyze your staffing levels by department or individual job title to ensure your brewery is never understaffed during a growth spurt.
Step-by-Step: Navigating the Headcount Report

-
Open the Report: Click the HC (Headcount) icon on the right-hand sidebar.
-
Select Your View: Use the dropdown menu in the top right to toggle between:
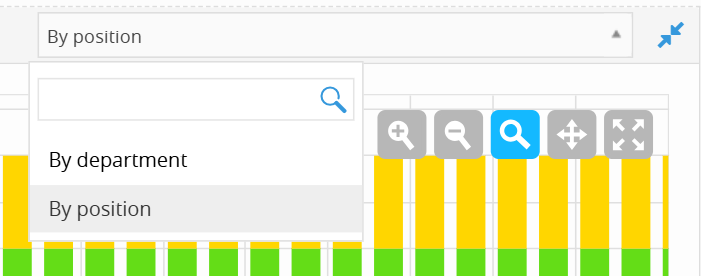
-
By department: Groups staff into broad categories (e.g., Brewing, Admin, Sales).
-
By position: Breaks down staff by specific job titles (e.g., Brewer, Tasting room staff).
-
-
Check the Timeline: Use the M, Q, or Y buttons to see hiring trends by month, quarter, or year.
-
Hover for Detailed Data: Move your cursor over any stacked bar to see the exact count for that month. For example, in image_868bc1.png, hovering over Oct 2027 shows you have 8 Sales staff, 1 Admin, and 1 Brewing staff.
-
Expand for Detail: Click the diagonal blue arrows in the top right to view the chart in full-screen mode.
- Colors/Legend: Look at the bottom of the chart to identify which color corresponds to which department or position.
Comparing the Two Views
| View Method | Best For... | Business Insight |
| By Department | Budgeting and high-level planning. | Are we spending too much on Sales vs. Production? |
| By Position | Operational deep-dives. | Do we have enough Tasting room staff to handle the summer rush? |
Tips
Why is my Headcount not increasing even though my sales are growing?
Check your Staffing Assumptions on the left sidebar. If you haven't set your staff to "Auto-scale" or haven't manually scheduled new hires, the system will keep your headcount flat, which might lead to a production bottleneck in your Operational Report.
What if I see a "fractional" headcount (e.g., 1.5 people)?
Decision Critical supports Part-Time staff. If you hire someone for 20 hours a week instead of 40, they will appear as 0.5 in the headcount report.
How does this affect my Cash Balance?
Every person added here increases your Salaries and Wages expense. If you see your Cash Balance turn red (Insolvent) immediately after a big "step" in headcount, you may need to delay your hiring or increase your sales targets.
The Equipment Roll-out Report
Think of the Equipment Roll-out report as the Physical Timeline for your business. Just as the Headcount report shows when you hire people, this report shows exactly when you plan to "plug in" new machinery, vehicles, or furniture.
In your current brewery scenario, this chart tracks everything from your Mash Lauter to your Half-barrel kegs.
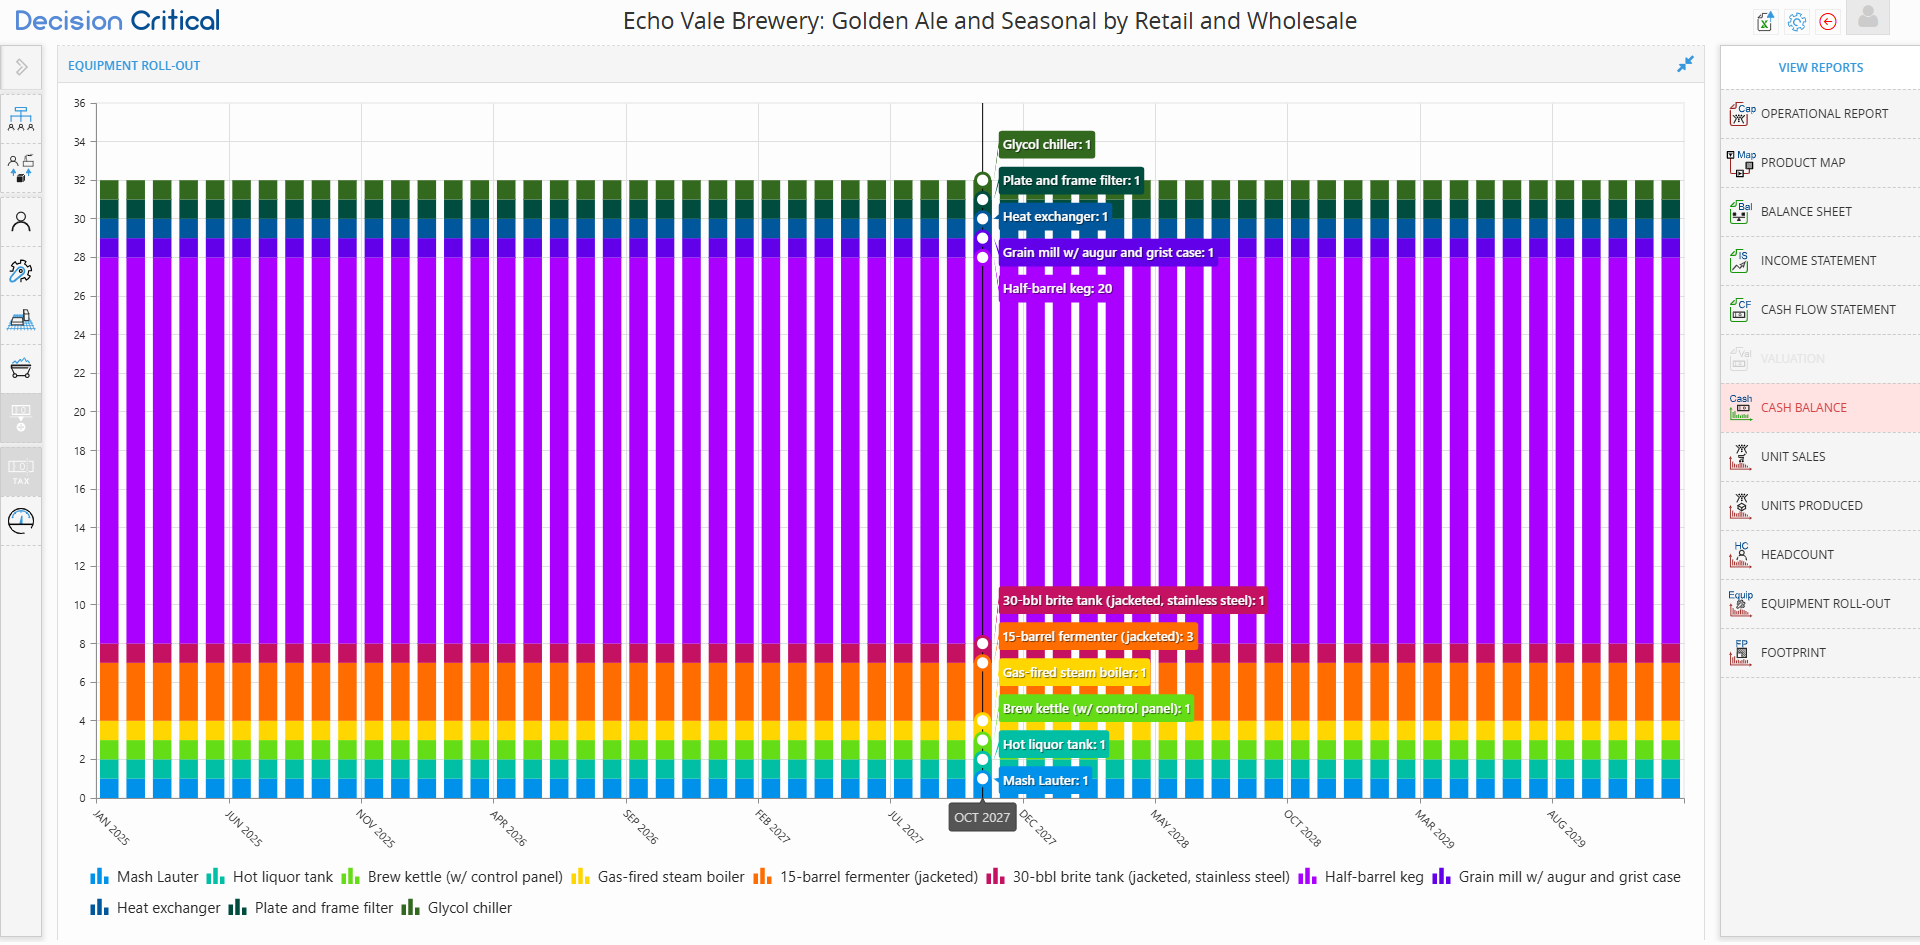
How to Read the Equipment Timeline
-
The Stacked Bars: Each color block represents a different type of equipment. The height of the bar tells you the total size of your "fleet" for that month.
-
The "Step" Effect: If you see a bar get taller from one month to the next, it means you've purchased new equipment. If the bars are flat (as they are in your image), it means you bought all your gear at the start and haven't added more since.
-
Hovering for Inventory: As you did in image_870709.png, hovering over a bar gives you an instant audit. For example, in Oct 2027, you can see you have 20 Half-barrel kegs and 3 Fermenters.
-
The Legend: Look at the bottom of the chart to identify which color belongs to which piece of gear (e.g., Purple = Half-barrel keg).
Why This Matters for Your Strategy
This report connects your physical capacity to your bank account:
-
Connecting to Cash Flow: Look back at your Cash Flow Statement. A huge "Purchase Equipment" expense should align exactly with the month your bars first appear or "step up" in this report.
-
Connecting to Production: If your Units Produced report shows a bottleneck, come here. Do you have enough Brite Tanks to handle the volume? If the bar for tanks is too short, you found your problem.
-
Connecting to Footprint: Every piece of equipment takes up space. If you add 10 new fermenters here, you need to check the Footprint report to make sure they actually fit in your building!
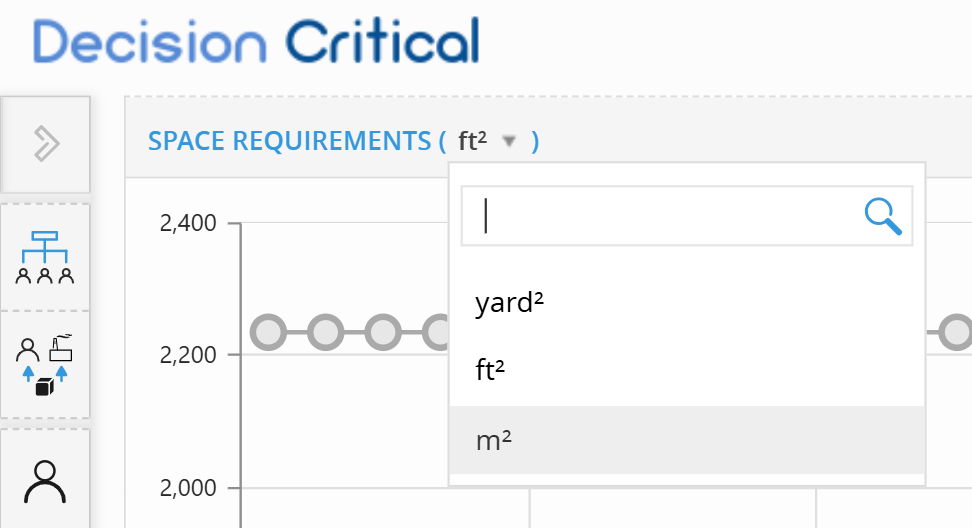
The Footprint Report
The Footprint report is the "Physical Reality Check" for your business. It ensures that the growth you’ve planned on paper—more beer, more machines, more people—actually fits inside your building. While other reports track dollars or units, this one tracks area.
Think of this as a bird’s-eye view of your brewery floor. It answers the critical question: "Do I have enough room for all the new equipment and staff I just added?"
Step-by-Step: Managing Your Floor Space
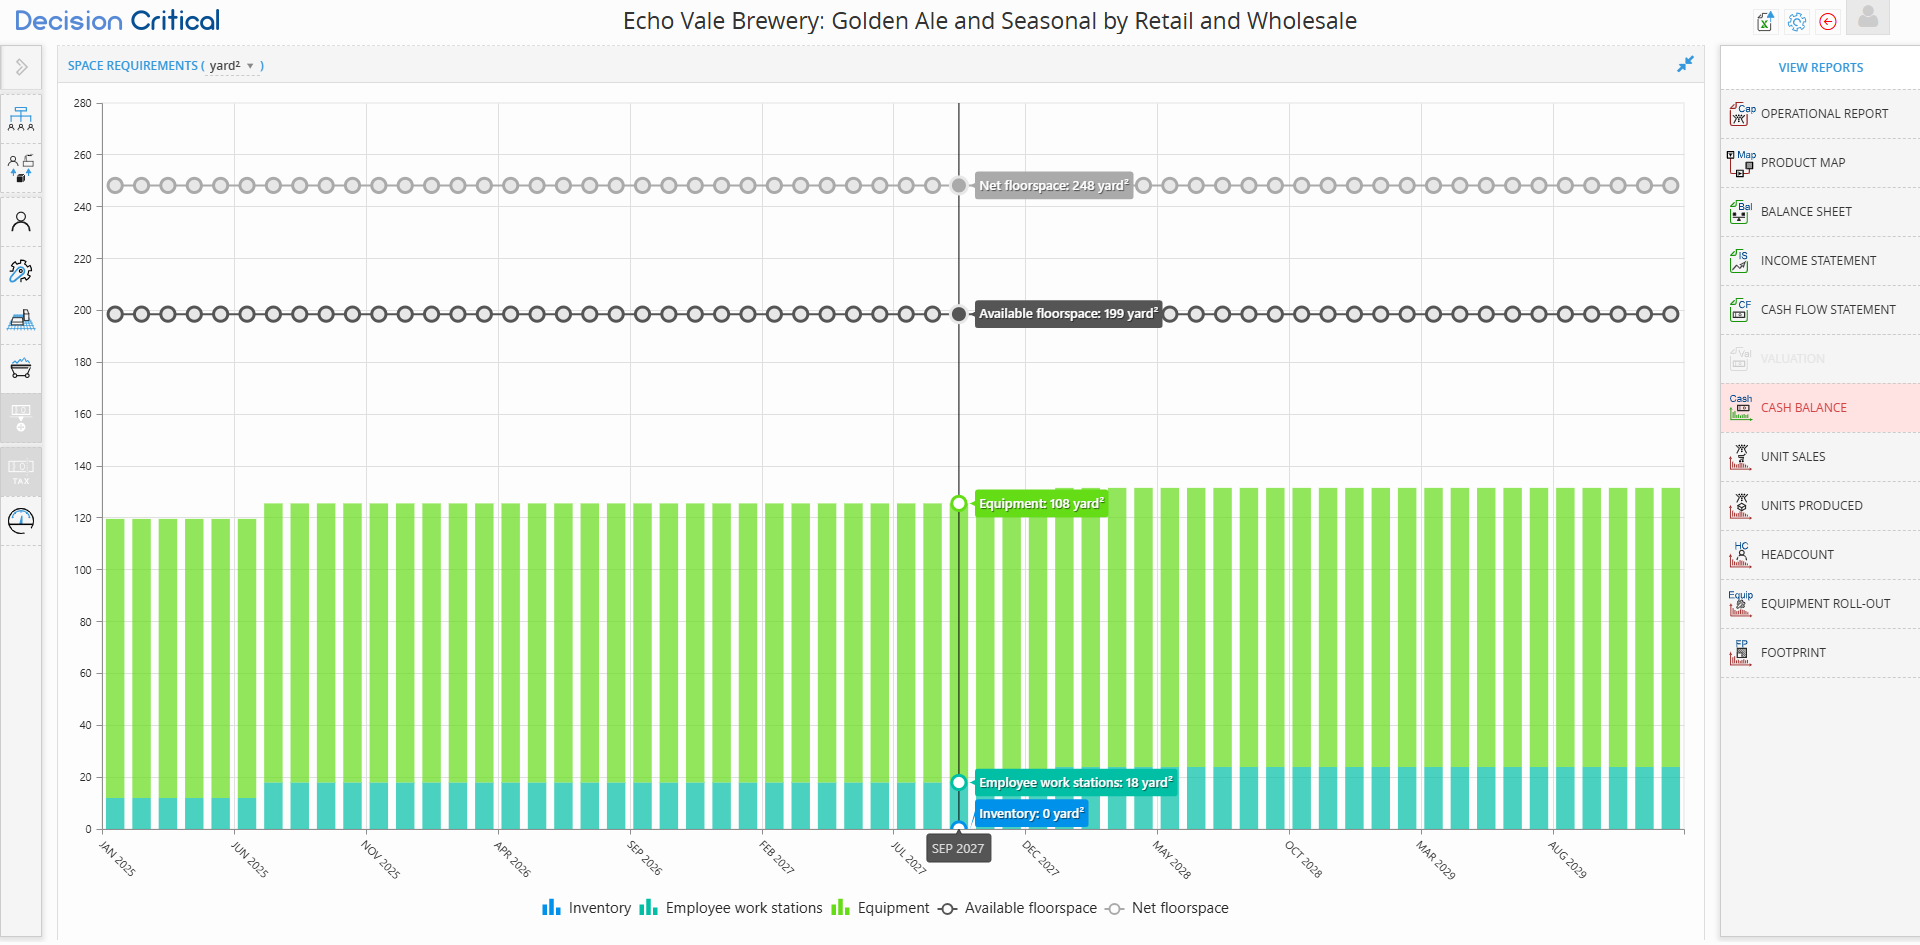
-
Open the Report: Click the FP (Footprint) icon on the right-hand sidebar.
-
Toggle Your Measurement Units: As seen in your image, you can click the dropdown arrow next to SPACE REQUIREMENTS to choose between yard, ft, or m. This is helpful for communicating with local contractors or landlords who may use different standards.
-
Identify the "Ceilings" (Lines):
-
Net Floorspace (Grey Circles): This is the total area of your building (the "Total Footprint").
-
Available Floorspace (Dark Circles): This is the "Usable" area. It accounts for space lost to aisles, bathrooms, and structural beams.
-
-
Identify the "Occupants" (Stacked Bars):
-
Light Green (Equipment): Space occupied by brew kettles, fermenters, and boilers.
-
Teal (Employee Work Stations): Space needed for desks, breakrooms, and lab stations.
-
Blue (Inventory): Space needed to store raw materials and finished beer kegs.
-
-
Hover for Measurement: Move your mouse over any month to see the exact breakdown.
Understanding Your Space Strategy
The goal is to keep your bars below the "Available Floorspace" line.
| If you see... | The Business Meaning | The Proactive Fix |
| Bars < Available Line | Room to Grow: You have extra floor space. You can add more equipment or staff without moving. | You have a "buffer" for sudden inventory spikes. |
| Bars = Available Line | Maxed Out: Every inch is occupied. You cannot grow further in this building. | Time to look for a Building Expansion in the Land and Buildings tab. |
| Bars > Available Line | Overcrowded: This is a safety hazard! Your machines and people are literally on top of each other. | You must either reduce equipment or upgrade to a larger building immediately. |
💡 If this doesn’t solve your issue or you have more questions, feel free to reach out through our [contact form]. We’ll get back to you within 2–3 business days.