Accessing the Historical Performance Module
Key Sections of the Historical Performance Page
Scenario Comparison in Variance Analysis
Variance Analysis in Decision Critical compares models, budgets and forecasts (built as scenarios in the Constructor module) with actual company results from financial reports (uploaded and managed in the Historical Performance module).
Together, these two distinct modules allow for comparing past predictions with actual results, evaluating assumptions and drilling down into drivers of company performance.
In addition, data in the Historical Performance can serve as a powerful source of assumptions for building out planning efforts in the Constructor.
Accessing the Historical Performance Module
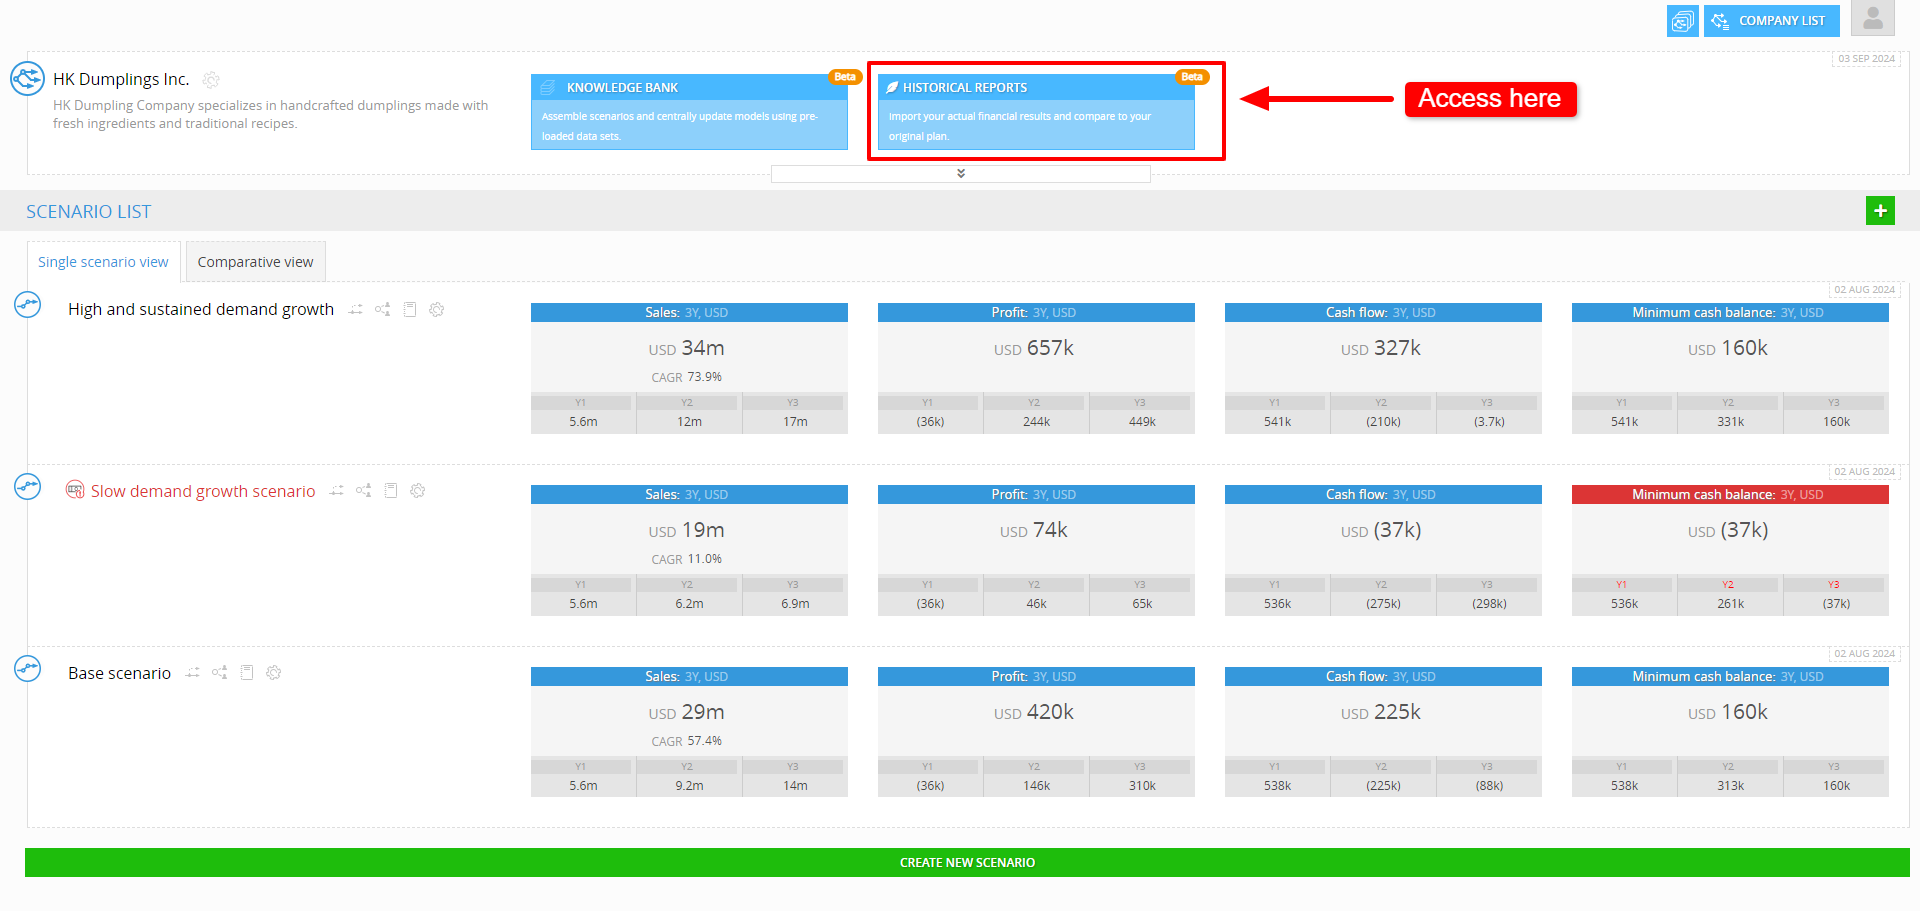
To access the Historical Performance module in Decision Critical, go to the /analytics page.
There, you'll see a tab labeled Historical Reports located next to the Knowledge Bank tab. Clicking on Historical Reports will take you directly to the main Historical Performance interface, where you can start reviewing and managing your company’s past financial and operational data.
Historical Performance: Module Structure
When you open the Historical Performance module in Decision Critical, you’ll find a comprehensive suite designed to help you review and manage data on your company's financial and operational results. The module currently supports month-to-month balance sheet and income statement reports, with cash flow statements and operational results expected soon.
The main Historical Performance interface uses the same report format (e.g. "chart of accounts") that is used for the company models in the Constructor. The Historical Performance module also has a "Source Format" interface, which contains data uploaded from the company's historical results kept in the company's customary monthly report format (usually the "chart of accounts" from the accounting system).
In most, the Source Format reports will be much more detailed than the report format used for forward-looking scenario models. Therefore the Source Format interface also has an account mapping function which allows you to organize your data by mapping accounts to each other in order to effectively compare past results to previous and future expectations.
Key Sections of the Main Historical Performance Interface

-
Top Navigation Bar:
- Date Range Selector: Found at the top left corner of the page, this tool allows you to select the time frame you want to review (MMM YYYY to MMM YYYY). Adjusting this range enables you to focus on specific periods relevant to your financial analysis.

- Report Tabs: Located just below the date range when expanded (and as small icons in the righthand border if collapsed), these tabs allow for toggling between Balance Sheet, Income Statement, Cash Flow Statement and Operational Information reports.
Note: the Cash Flow Statement and Operational Information report are currently locked, as they are still under development.
- Date Range Selector: Found at the top left corner of the page, this tool allows you to select the time frame you want to review (MMM YYYY to MMM YYYY). Adjusting this range enables you to focus on specific periods relevant to your financial analysis.
-
Customizing the View:
- Show/Hide Accounts: This feature is accessible through the “Customize Accounts” button above the main data grid. It allows you to control which accounts are visible, helping you to narrow down the displayed information to focus on specific data relevant to your analysis.
- Data Entry: Below the timeline, the main grid displays your financial data once entered. Initially, you may see "NA" (Not Available) in empty fields. If you opt for manual data input instead of importing your reports, or if you want to manually change a number, clicking on these fields allows you to input your data directly into the system.
-
Additional Tools and Options:

- Custom Format: This button opens the Custom Format interface, allowing users access to source data in the original report format (chart of accounts) used during data import. This is helpful if you need to review or adjust the mapping of your accounts after the initial setup or get quick access to more granular data.
- Export to spreadsheet: The export button, also found at the top right, lets you download your financial data in spreadsheet format. This is useful for offline analysis or creating backup records.
- Expand / Collapse window: Located in the top right corner, this option lets the user enter / exit full screen mode.
-
Account Display Options:
- Main Data Grid: This section shows all financial data for the selected period. It includes several indicators:
- Blue Text: Blue text anywhere in this report indicates the presence of sub-accounts under a main category. Clicking on the blue text will expand the view to show detailed entries.
- Ellipsis (Three Dots): Located next to account names like "Cash in Bank" or "Accounts Receivable," this icon provides options to view a detailed breakdown of the items that make up the account (per the source format), and also to batch verify data, or to clear all data for the entire account.

- Verification Button: Confirm that all data entries for the account are accurate, ensuring they are ready for use in analysis (they will all be marked as "Verified" inputs).
- Clear Data: Offers the option to remove all data entries for the selected account, useful if you need to clear incorrect data.
- Input Detail: This button opens a detailed view of the account data from the source reports.
- Main Data Grid: This section shows all financial data for the selected period. It includes several indicators:
-
Managing Individual Data Entries:
When you hover over a specific cell, you will see its "Actions" icon, which contains a menu of actions which can be applied to specific data points within the cells of a grid, allowing for granular control:


- Verification Button: This option lets you mark a specific data entry as "Verified." Verifying an entry confirms that the data is accurate and has been checked by an authorized user. Once an entry is verified, it is generally locked to prevent further changes, ensuring the data is reliable for financial reports and analyses.
- Clear Entry: This option lets you remove a specific data point from a cell. It’s helpful when you need to delete an incorrect entry or reset it to enter new data. Clearing individual entries ensures data accuracy at the most granular level.
- Copy value: For accounts which do not see a lot of movement, or which have the same value in each period, Copy Value is a shortcut to avoid manual input of the same number into several consecutive months.
- Input Detail: By selecting this option, you can view the detailed breakdown of a particular data point into specific sub-accounts from source reports. This is useful for reviewing and verifying values in the Historical Performance interface which are made up of input data from multiple sub-accounts.
Using Variance Analysis
Once your historical data is confirmed and aligns with your scenarios, Decision Critical offers Variance Analysis functionality via visualizations comparing the data sets on a month-to-month basis.
Variance analysis in the Historical Performance interface can be viewed via the icons located under the date column header for the starting date of the scenario.

Scenario Comparison in Variance Analysis
For comparing multiple scenarios to actual historical performance, you can use the Comparative View in the Scenario List tab. Here’s how to set it up:
-
Navigate to Comparative View: If you're in Historical Performance, locate the close button at the top right. Clicking this button will redirect you to the scenario page.

-
Select Comparative View: In the scenario page, look for the Comparative View tab. Click on it to enter the comparative analysis mode.

-
Choose a Report: In the report tab, select the report you want to see. The visualization pane will display graphs of scenario and actuals (from Historical Performance)
Actuals will be shown in black line. Hover on any period to see tooltips showing the value of each scenario (including actuals).

Customize Scenario View: Use the menu icon at the top left of the visualization pane to display or hide specific scenarios. This allows you to focus on the comparisons that matter most to your analysis.
You can see the full guide on performing Variance Analysis here.
Note that before starting Variance Analysis, make sure to add all the necessary historical data in the Historical Performance section. Feel free to check out our other guides for more helpful information!
Need help? 💡
If you need additional help, reach out to us at:
support@decisioncritical.pro